How to graph X Y Z data in 3D inside Microsoft Excel with XYZ Rotations
Summary
TLDRThis video tutorial explores how to graph XYZ data in 3D using Microsoft Excel. It covers two methods: the simpler approach using the 'Cell Tools' add-in, which allows easy creation of interactive 3D graphs with rotation, zooming, and panning features; and a more complex method involving user-defined formulas to convert XYZ data into 2D graphs. The tutorial also highlights resources from George Lung Goo and his work on Excel’s mathematical equations for 3D graphing. Whether for quick results or advanced users, this video provides valuable insights into 3D graphing in Excel.
Takeaways
- 😀 Cell Tools is an Excel add-in that simplifies creating 3D graphs from XYZ data with rotation, zoom, and pan features.
- 😀 With Cell Tools, users can easily select a 3D graph type and have it generated in a new sheet with interactive controls for viewing.
- 😀 The 3D graphs created in Excel can be shared via email, and recipients can interact with the graph in the same way as the creator.
- 😀 The video covers two methods for graphing XYZ data in 3D: using the Cell Tools add-in (simple) and manually with formulas (advanced).
- 😀 The Cell Tools add-in is the easiest way to graph XYZ data, offering quick, intuitive controls for 3D graphs.
- 😀 For a more advanced method, users can create 3D graphs manually by converting XYZ data into X and Y values using specific formulas.
- 😀 The manual method requires understanding rotation formulas to adjust the graph's X and Y values for proper 3D plotting.
- 😀 George Lung Goo has provided helpful resources on the mathematical equations behind 3D graphing in Excel, available on his website, Excel Unusual.
- 😀 The manual method for 3D graphing is more complex, requiring users to input rotation and altitude values to adjust the graph's appearance.
- 😀 The video encourages viewers to explore both methods of graphing and suggests subscribing for more tutorials on Excel graphing techniques.
Q & A
What is the main focus of the video tutorial?
-The main focus of the video tutorial is how to graph XYZ data in 3D using Microsoft Excel, specifically using line spline or scatter charts.
What tool is introduced in the video to simplify 3D graphing in Excel?
-The tool introduced in the video is the Excel add-in called Cell Tools, which provides features for graphing XYZ data in 3D easily.
How does the Cell Tools add-in make 3D graphing in Excel easier?
-The Cell Tools add-in simplifies 3D graphing by allowing users to easily select a 3D graph type, which is then automatically generated. It also includes features for rotation, zooming, and panning within the Excel sheet.
Can the 3D graph created using Cell Tools be shared with others?
-Yes, since the 3D graph is contained within the Excel document, it can be emailed to others, who can then rotate, zoom, and pan just like the original user.
What is the alternative method to graph XYZ data in 3D using Excel?
-The alternative method involves using user-defined formulas inside Excel to convert XYZ data into X and Y data and then graph it, which is more complex than using the Cell Tools add-in.
What is the primary challenge when graphing XYZ data using Excel’s built-in functions?
-Excel can only graph two data points (X and Y), so the XYZ data needs to be converted into X and Y data before it can be graphed, which requires mathematical equations.
Where can users learn more about the mathematical equations behind 3D graphing in Excel?
-Users can learn more about the mathematical equations from George Lung Goo’s tutorials on Excel Unusual, which explains the complexities behind 3D graphing in Excel.
What is the purpose of the formulas in the alternative method for 3D graphing?
-The formulas in the alternative method are used to convert XYZ values into X and Y values, allowing users to graph 3D data in Excel.
What additional elements can users adjust when creating a 3D graph using the user-defined formula method?
-Users can adjust the rotation and altitude values, which will automatically update the graphed X and Y values in real-time.
Is the user-defined formula method easier or more difficult than using the Cell Tools add-in?
-The user-defined formula method is more difficult and complex than using the Cell Tools add-in, as it requires understanding and applying mathematical equations.
Outlines

Этот раздел доступен только подписчикам платных тарифов. Пожалуйста, перейдите на платный тариф для доступа.
Перейти на платный тарифMindmap

Этот раздел доступен только подписчикам платных тарифов. Пожалуйста, перейдите на платный тариф для доступа.
Перейти на платный тарифKeywords

Этот раздел доступен только подписчикам платных тарифов. Пожалуйста, перейдите на платный тариф для доступа.
Перейти на платный тарифHighlights

Этот раздел доступен только подписчикам платных тарифов. Пожалуйста, перейдите на платный тариф для доступа.
Перейти на платный тарифTranscripts

Этот раздел доступен только подписчикам платных тарифов. Пожалуйста, перейдите на платный тариф для доступа.
Перейти на платный тарифПосмотреть больше похожих видео

Mengenal Data Angka | Materi Informatika/TIK SMP Kelas 7
cara object linking and embedding | integrasi office

Membuat Dot Plot dengan Bantuan MS Excel 2016
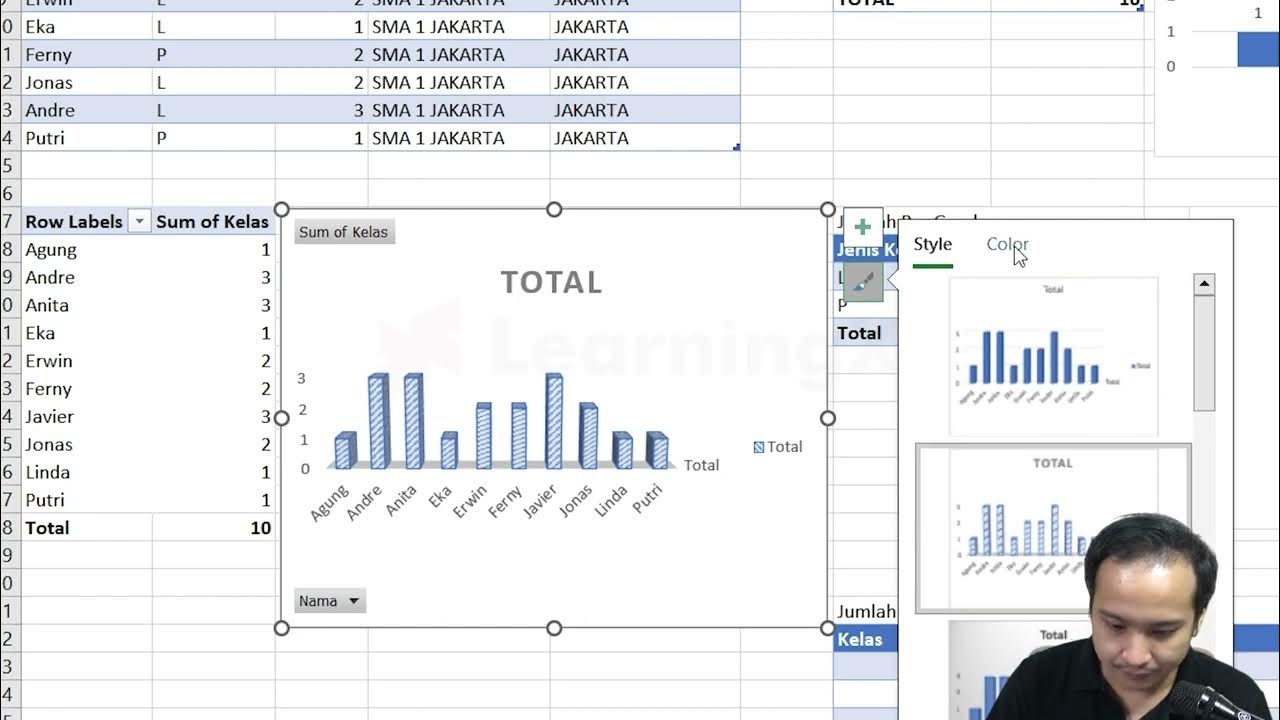
Chapter 5 - Tutorial Analisa Data Part 3 (Pivot Table) | Informatika Booster

23. Literasi Digital - Rumus dan Fungsi Dasar pada Excel - Informatika Kelas X
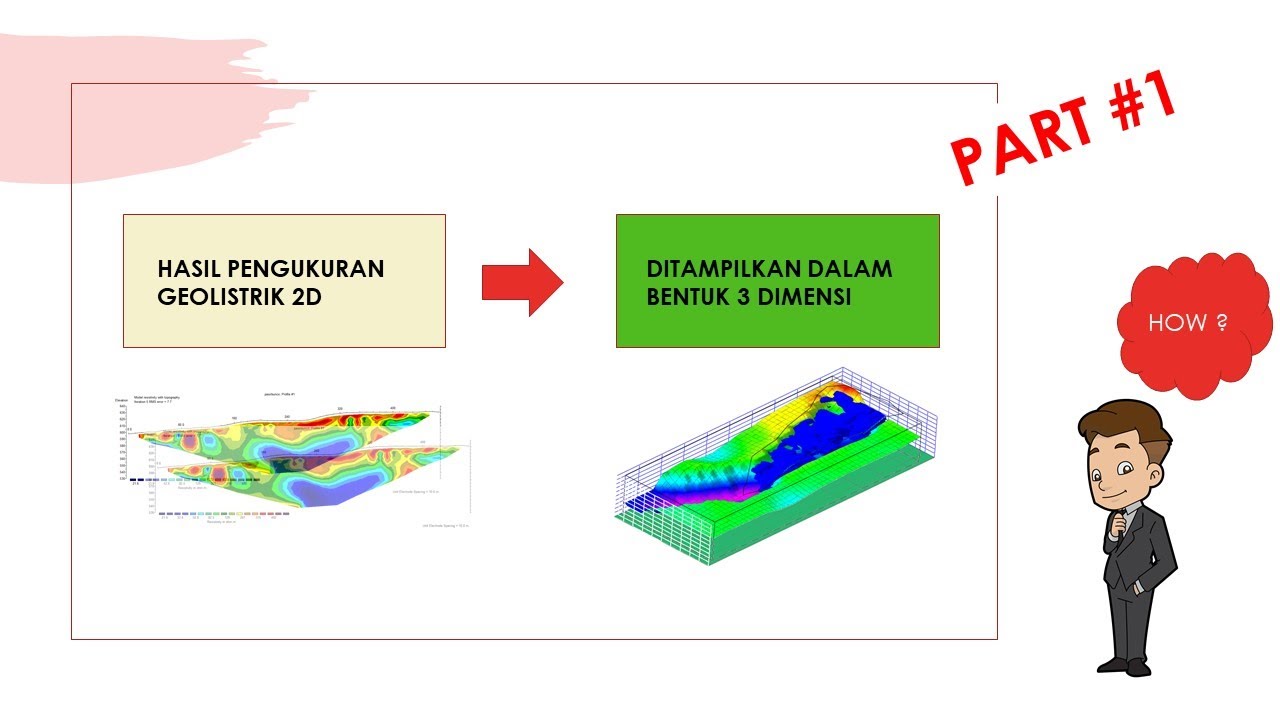
Visualisasi Geolistrik 3 D - PART #1
5.0 / 5 (0 votes)
