PERBEDAAN STATISTIK DESKRIPTIF DAN INFERENSIAL
Summary
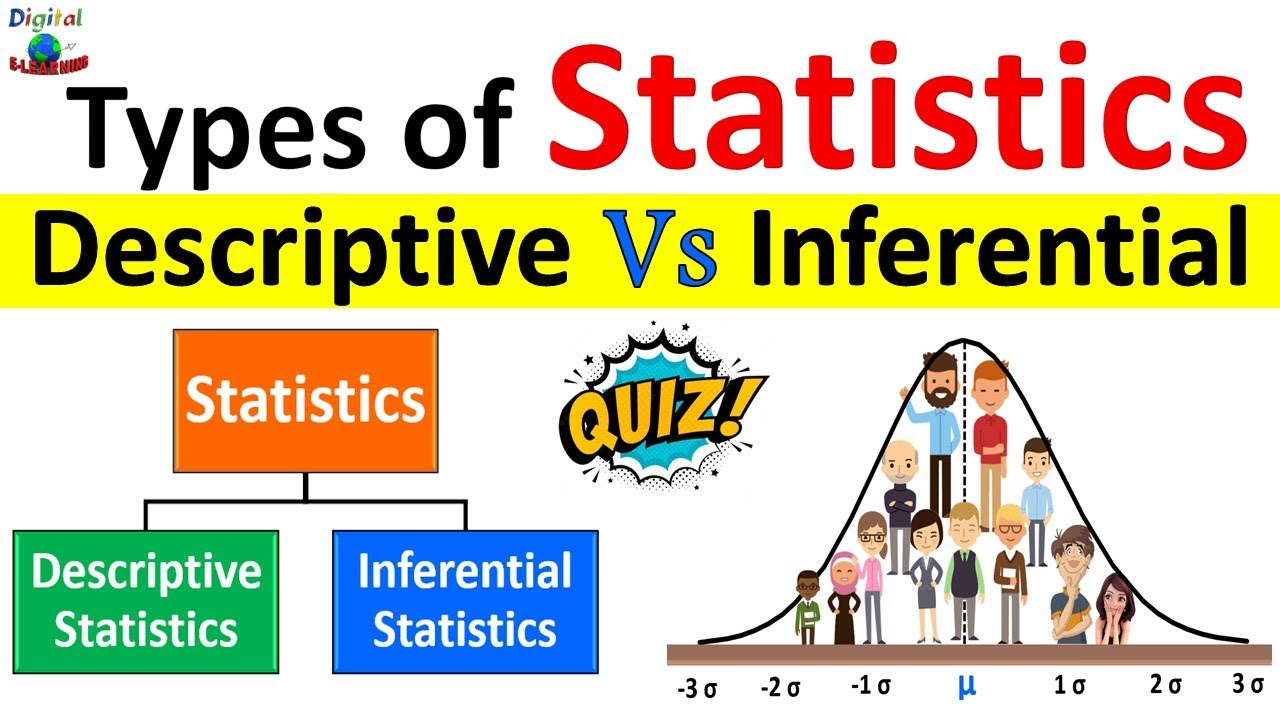
TLDRThis video provides an insightful explanation of statistics and its subfields. It clarifies the distinction between 'statistic'—the data or values used to represent a population—and 'statistical science'—the study of data collection, analysis, and interpretation. The video delves into descriptive statistics, focusing on summarizing data, and inferential statistics, which deals with making conclusions from sample data and generalizing them to a larger population. It emphasizes the importance of sampling methods and the two main techniques in inferential statistics: hypothesis testing and parameter estimation.
Takeaways
- 😀 Statistics (Statistik) is the practice of summarizing and interpreting data using methods like averages and graphical representations.
- 😀 Statistical science (Statistika) is the broader field that encompasses data collection, analysis, and inference-making using probability and uncertainty.
- 😀 Descriptive statistics is used to describe the main features of a dataset, such as calculating averages, variances, and standard deviations.
- 😀 Inferential statistics involves drawing conclusions about a population based on a sample, using methods like hypothesis testing and parameter estimation.
- 😀 Data is represented in tables and graphs to make it easier to interpret and understand, as shown by the example of average rice prices in 2020.
- 😀 A **population** refers to the entire group of data or characteristics you're analyzing, while a **sample** is a subset of that population.
- 😀 In inferential statistics, conclusions from a sample can be generalized to the population if the sample is truly representative.
- 😀 Hypothesis testing is a method used in inferential statistics to make conclusions or predictions based on a sample's data.
- 😀 Parameter estimation involves calculating values that represent the characteristics of a population, such as the mean or variance.
- 😀 The distinction between statistics and statistical science lies in the scope: statistics is about presenting and describing data, while statistical science involves deeper analysis and making inferences.
Q & A
What is the difference between statistics and statistika?
-Statistics refers to the field of data analysis, involving the collection, presentation, and analysis of data, often through values like averages or standard deviations. Statistika, on the other hand, is the branch of science that focuses on methods for gathering, analyzing, interpreting, and drawing conclusions from data, considering uncertainty and probability.
What is meant by 'statistical data' in the context of the script?
-Statistical data refers to a set of collected data that represents certain characteristics, like the average price of rice in this example. The data is typically presented in tables or graphs to summarize key trends or values.
What does the term 'statistical inference' refer to?
-Statistical inference involves drawing conclusions or making predictions about a population based on a sample of data. It includes processes like hypothesis testing and parameter estimation, where the sample's results are generalized to the larger population, provided the sample is representative.
What is the difference between descriptive and inferential statistics?
-Descriptive statistics focuses on summarizing and describing the main features of a dataset, such as calculating averages or plotting data on graphs. Inferential statistics, however, goes further by making conclusions or predictions about a population based on a sample, often involving hypothesis testing and parameter estimation.
How is 'average price of rice' used in the script?
-The average price of rice is used as an example of statistical data. The script explains how this data is presented in a table and how it can be interpreted through descriptive statistical methods.
What role does uncertainty play in statistics?
-Uncertainty is a key element in statistics because data analysis often involves working with probabilities. There’s always a chance of error or variation in the results, and statisticians account for this uncertainty when drawing conclusions or making predictions.
What is a population in statistical terms?
-In statistics, a population refers to the entire set of data or observations that share a characteristic being studied. For example, the entire group of rice prices for a year would be considered a population in this context.
What is a sample, and how does it relate to statistical inference?
-A sample is a smaller, representative subset of the population. In statistical inference, the sample is used to make generalizations or draw conclusions about the larger population, ensuring that the sample accurately reflects the characteristics of the population.
What is the significance of hypothesis testing in statistical inference?
-Hypothesis testing is a method used in inferential statistics to assess the validity of a claim or assumption about a population. It involves using sample data to evaluate whether there is enough evidence to support or reject a hypothesis.
What are some examples of statistical values mentioned in the script?
-The script mentions several statistical values, including averages, variance, and standard deviation. These values represent key characteristics of a dataset, helping to summarize or describe the data's distribution and spread.
Outlines

Этот раздел доступен только подписчикам платных тарифов. Пожалуйста, перейдите на платный тариф для доступа.
Перейти на платный тарифMindmap

Этот раздел доступен только подписчикам платных тарифов. Пожалуйста, перейдите на платный тариф для доступа.
Перейти на платный тарифKeywords

Этот раздел доступен только подписчикам платных тарифов. Пожалуйста, перейдите на платный тариф для доступа.
Перейти на платный тарифHighlights

Этот раздел доступен только подписчикам платных тарифов. Пожалуйста, перейдите на платный тариф для доступа.
Перейти на платный тарифTranscripts

Этот раздел доступен только подписчикам платных тарифов. Пожалуйста, перейдите на платный тариф для доступа.
Перейти на платный тарифПосмотреть больше похожих видео

Distribusi Frekuensi: Definisi, Fungsi, dan Jenis-Jenisnya

Konsep Dasar Biostatistik
Descriptive Statistics vs Inferential Statistics | Measure of Central Tendency | Types of Statistics

Saksikan Sosialisasi Olimpiade Sains Nasional (OSN-K) Bidang Biologi SMA/SMK/MA/MAK/Sederajat 2025

Dasar-Dasar EKG (Prinsip EKG) : #1 ELEKTROKARDIOGRAM

1 Ruang Lingkup Fisika X #2
5.0 / 5 (0 votes)
