Praktikum Ekonometrika I P4 - Regresi Linier Berganda
Summary
TLDRIn this video, the topic of multiple linear regression models is discussed, focusing on the estimation and analysis using various data-processing software. The script covers the steps to perform regression analysis, including deriving coefficients, calculating variances, and using matrix operations. It also explains the ANOVA table, hypothesis testing, and the application of F-statistics. Practical examples, such as predicting detergent demand based on factors like price, advertising, and income, are provided. The video guides viewers through manual calculations in Excel and software-based regression analysis using Stata, highlighting the significance of the results and the interpretation of coefficients.
Takeaways
- 😀 The video discusses multiple regression analysis using various data processing software.
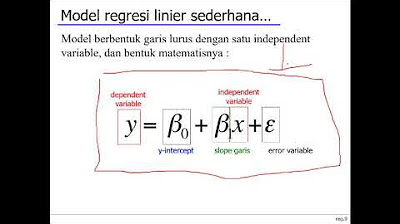
- 😀 The formula for multiple linear regression includes one dependent variable and multiple independent variables.
- 😀 The approach for calculating regression coefficients is explained using matrix multiplication methods.
- 😀 The importance of the Anova table in regression analysis is emphasized, particularly for testing overall model significance.
- 😀 F-tests are used to check whether at least one independent variable significantly impacts the dependent variable.
- 😀 The example in the video uses a dataset of 30 observations, focusing on demand and factors like price, advertising, and income.
- 😀 The matrix calculation approach for regression coefficients is demonstrated using Excel.
- 😀 The ANOVA table is crucial for determining the model's effectiveness in explaining the variation in the dependent variable.
- 😀 A significant F-value indicates that the model can explain the variation in the dependent variable, while a low p-value confirms this.
- 😀 A t-test is applied to evaluate the significance of individual variables, such as advertising costs, in predicting demand.
- 😀 The regression output from Stata confirms the results obtained through matrix calculations in Excel, demonstrating the power of both software tools for regression analysis.
Q & A
What is the topic of the econometrics class discussed in the transcript?
-The topic discussed in the transcript is about multiple linear regression models, particularly focusing on estimating coefficients using matrix multiplication methods and performing ANOVA analysis.
What is the general form of a multiple linear regression equation?
-The general form of a multiple linear regression equation is Y = β0 + β1*X1 + β2*X2 + ... + βp*Xp + ε, where Y is the dependent variable, X1 to Xp are the independent variables, β0 to βp are the coefficients, and ε is the error term.
How is the regression coefficient estimated in the context of multiple linear regression?
-The regression coefficients can be estimated using matrix operations, where β = (X'X)^-1 * X'Y, where X is the matrix of independent variables, Y is the dependent variable, and X' denotes the transpose of matrix X.
What is the purpose of conducting an ANOVA in the context of multiple linear regression?
-The purpose of conducting an ANOVA (Analysis of Variance) in regression analysis is to evaluate the overall significance of the regression model, determining whether at least one of the independent variables significantly influences the dependent variable.
What is the role of the F-statistic in regression analysis?
-The F-statistic in regression analysis is used to test the null hypothesis that all regression coefficients are equal to zero. If the F-statistic is large enough, it suggests that at least one independent variable significantly affects the dependent variable.
What does the p-value represent in hypothesis testing for regression analysis?
-In hypothesis testing, the p-value indicates the probability of observing the given data, or something more extreme, assuming that the null hypothesis is true. If the p-value is smaller than a predetermined significance level (e.g., 0.05), the null hypothesis is rejected.
How is the ANOVA table constructed in the context of regression analysis?
-The ANOVA table is constructed by calculating the sum of squares for regression, residuals, and total, followed by computing the mean squares (sum of squares divided by degrees of freedom), and the F-statistic (mean square of regression divided by mean square of residuals).
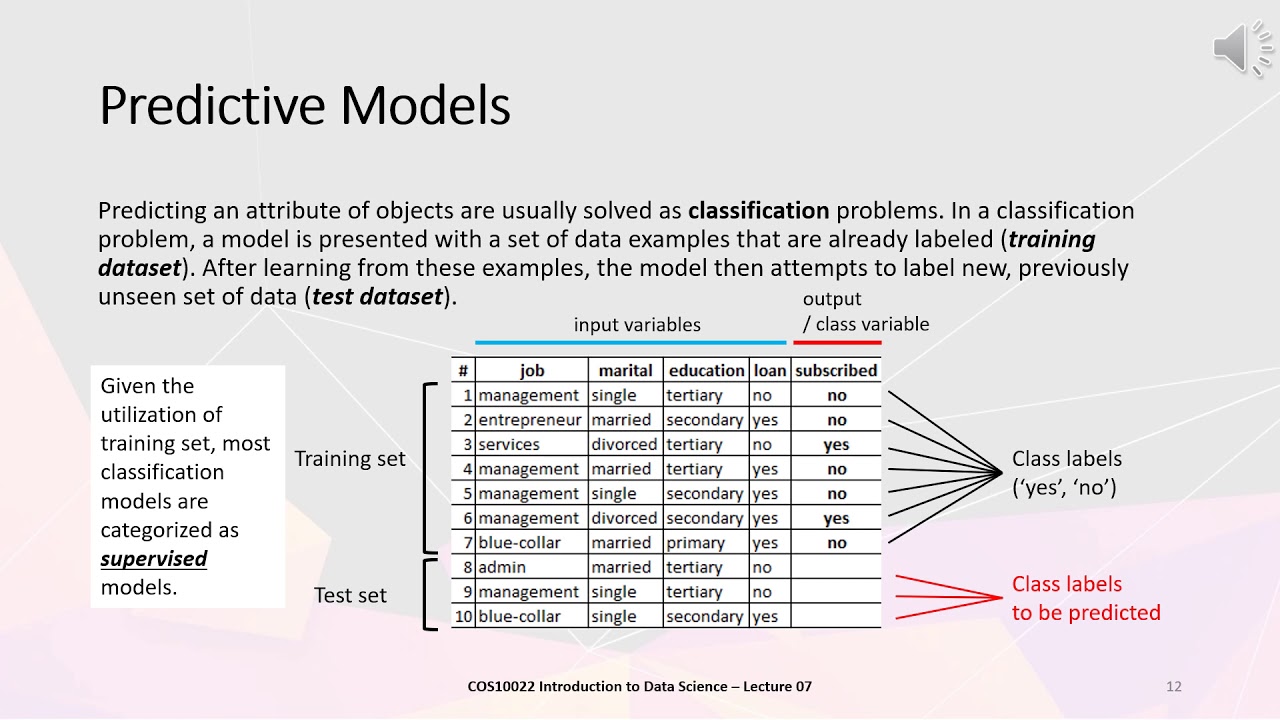
What is the difference between a dependent and independent variable in a regression model?
-In a regression model, the dependent variable (Y) is the outcome or the variable being predicted, while independent variables (X1, X2, etc.) are the predictors or factors assumed to influence the dependent variable.
What does the coefficient of determination (R-squared) represent in regression analysis?
-The coefficient of determination (R-squared) measures the proportion of the variance in the dependent variable that is explained by the independent variables in the regression model. A higher R-squared value indicates a better fit of the model to the data.
What is the interpretation of a positive coefficient in the regression equation?
-A positive coefficient in the regression equation indicates a direct relationship between the independent variable and the dependent variable, meaning that as the independent variable increases, the dependent variable is expected to increase, assuming all other variables are constant.
Outlines

Этот раздел доступен только подписчикам платных тарифов. Пожалуйста, перейдите на платный тариф для доступа.
Перейти на платный тарифMindmap

Этот раздел доступен только подписчикам платных тарифов. Пожалуйста, перейдите на платный тариф для доступа.
Перейти на платный тарифKeywords

Этот раздел доступен только подписчикам платных тарифов. Пожалуйста, перейдите на платный тариф для доступа.
Перейти на платный тарифHighlights

Этот раздел доступен только подписчикам платных тарифов. Пожалуйста, перейдите на платный тариф для доступа.
Перейти на платный тарифTranscripts

Этот раздел доступен только подписчикам платных тарифов. Пожалуйста, перейдите на платный тариф для доступа.
Перейти на платный тарифПосмотреть больше похожих видео


5.0 / 5 (0 votes)
