Presentasi Tentang Cara Membaca Grafik Data Hasil Pengujian Uji Tarik
Summary
TLDRThis video provides an in-depth explanation of how to read and interpret data from a tensile test specimen graph. The presenter covers key concepts, such as stress, strain, elastic and plastic regions, maximum tensile strength, and the toughness of the material. The process also includes identifying points like the yield point, maximum stress, and break point, as well as calculating material properties like ductility and Young’s modulus. It is an informative guide on understanding the behavior of materials under tension, with a focus on how to extract valuable data from the graph.
Takeaways
- 😀 The script discusses how to read and interpret data from a tensile test specimen graph.
- 😀 The Y-axis of the graph represents stress, while the X-axis represents strain.
- 😀 The yield point is identified on the graph as the point where the specimen begins to deform plastically.
- 😀 The maximum tensile strength point shows the highest stress the specimen can withstand before failure.
- 😀 The maximum strain point indicates the highest elongation the specimen reaches before breaking.
- 😀 The breaking point is where the specimen fractures, which marks the maximum stress it can bear.
- 😀 The elastic region on the graph shows where the specimen returns to its original shape after stress is removed.
- 😀 The plastic region represents permanent deformation after the yield point has been surpassed.
- 😀 Toughness is represented by the area under the curve on the graph, which quantifies energy absorption before fracture.
- 😀 Ductility can be calculated by subtracting the yield strain from the strain at fracture.
- 😀 Young’s Modulus is determined by dividing the maximum stress by the corresponding elongation, which reflects the material's stiffness.
Q & A
What is the purpose of the tensile test on specimens?
-The tensile test is performed to assess how a material behaves under tension, measuring its ability to withstand stretching forces and determining its strength and ductility.
What do the X and Y axes represent in the stress-strain graph of the tensile test?
-The Y-axis represents the stress (force per unit area) on the specimen, while the X-axis represents the strain (deformation or elongation) of the specimen.
What is the significance of the yield point on the stress-strain graph?
-The yield point is where the material starts to deform plastically, meaning it no longer returns to its original shape after the stress is removed.
What is the tensile strength and how is it identified in the graph?
-Tensile strength is the maximum stress the material can withstand before breaking. It is identified as the highest point on the stress-strain curve.
What does the maximum strain point indicate on the graph?
-The maximum strain point indicates the highest level of elongation the specimen can undergo before failure, corresponding to the material's ductility.
What is the difference between elastic and plastic regions on the stress-strain curve?
-The elastic region is where the material returns to its original shape after the stress is removed, while the plastic region is where the material permanently deforms.
What is toughness and how is it represented on the graph?
-Toughness is the material's ability to absorb energy before breaking, and it is represented by the area under the stress-strain curve.
How is ductility determined from the stress-strain graph?
-Ductility is determined by the amount of strain the material undergoes before breaking, and it is calculated by subtracting the strain at yield point from the strain at fracture.
What is Young's Modulus, and how is it calculated from the graph?
-Young's Modulus is a measure of the material's stiffness. It is calculated as the ratio of stress to strain in the elastic region, and it can be obtained by dividing the maximum stress by the maximum strain in that region.
What is the break point, and where is it found on the graph?
-The break point is the point where the specimen completely fails and breaks. It is identified at the end of the stress-strain curve, where the material loses all structural integrity.
Outlines

Этот раздел доступен только подписчикам платных тарифов. Пожалуйста, перейдите на платный тариф для доступа.
Перейти на платный тарифMindmap

Этот раздел доступен только подписчикам платных тарифов. Пожалуйста, перейдите на платный тариф для доступа.
Перейти на платный тарифKeywords

Этот раздел доступен только подписчикам платных тарифов. Пожалуйста, перейдите на платный тариф для доступа.
Перейти на платный тарифHighlights

Этот раздел доступен только подписчикам платных тарифов. Пожалуйста, перейдите на платный тариф для доступа.
Перейти на платный тарифTranscripts

Этот раздел доступен только подписчикам платных тарифов. Пожалуйста, перейдите на платный тариф для доступа.
Перейти на платный тарифПосмотреть больше похожих видео

Modul A - Uji Tarik

Pengujian Tarik
Tutorial Uji Asumsi Klasik (Prasyarat) Beserta Uji Regresi Berganda Dengan SPSS
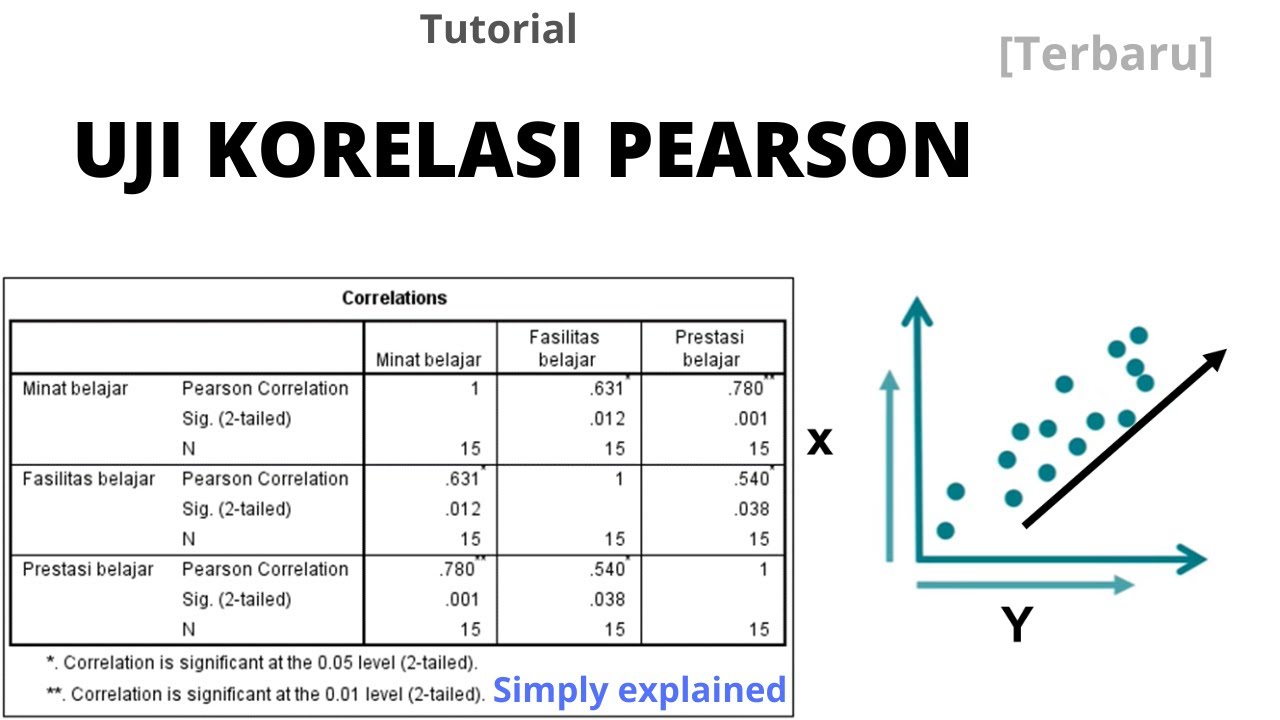
Memahami Uji Korelasi Pearson dan Cara Analisis dengan SPSS

[Tagalog] Pearson (r) Product Moment Correlation Coefficient - Computation and Interpretation
PENYAJIAN DATA DALAM BENTUK DIAGRAM GARIS || PENGOLAHAN DATA
5.0 / 5 (0 votes)
