Menentukan Variabel Bebas dan Variabel Terikat - Matematika Wajib SMA Kelas XI Kurikulum Merdeka
Summary
TLDRIn this educational video, the speaker explains the concepts of independent and dependent variables, essential for creating scatter diagrams in mathematics. Using various examples, the speaker demonstrates how independent variables (like vehicle speed, length of stay, solar panel area, and vehicle lifespan) influence dependent variables (like travel time, accommodation fee, energy output, and resale value). Viewers are encouraged to practice identifying these variables and understanding their relationships. The video aims to help students grasp the importance of correctly distinguishing between these variables for accurate data analysis and drawing conclusions, particularly for high school mathematics under the Merdeka Curriculum.
Takeaways
- 😀 Scatter diagrams are an important concept in high school mathematics (11th grade, Merdeka Curriculum).
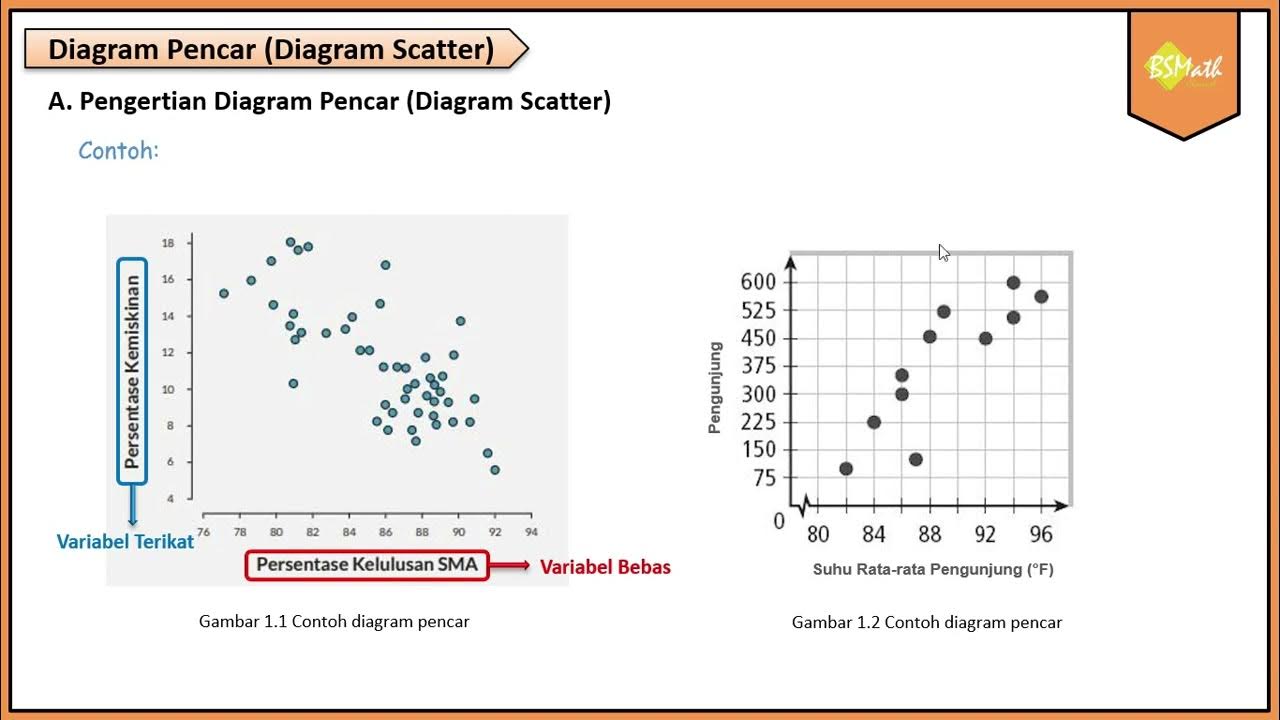
- 😀 A scatter diagram represents the relationship between two variables, where one is independent and the other is dependent.
- 😀 The independent variable is used to predict or influence the dependent variable, forming a cause-and-effect relationship.
- 😀 The dependent variable changes in response to the independent variable.
- 😀 An easy way to remember: the independent variable is the 'cause' and the dependent variable is the 'effect'.
- 😀 Examples include the relationship between vehicle speed and travel time, where speed is the independent variable.
- 😀 Another example is the relationship between the length of hotel stay and rent, where the length of stay is the independent variable.
- 😀 The area of a solar panel determines the energy output, making panel area the independent variable.
- 😀 Vehicle lifespan impacts its resale value, with lifespan being the independent variable.
- 😀 Shipping cost depends on package weight, where weight is the independent variable.
- 😀 To accurately plot a scatter diagram, it is crucial to identify the independent and dependent variables to avoid incorrect conclusions.
Q & A
What is the concept of independent and dependent variables in a scatter diagram?
-In a scatter diagram, an independent variable (variabel bebas) is the one used to predict or influence the dependent variable (variabel terikat). The dependent variable is affected by changes in the independent variable.
Why is it important to correctly identify independent and dependent variables?
-Correctly identifying independent and dependent variables is crucial because mixing them up can lead to incorrect conclusions and analyses in the diagram and subsequent predictions.
What is an example of independent and dependent variables when considering the speed of a vehicle and the time taken to travel?
-In this case, the independent variable is the speed of the vehicle, as it influences the time taken to travel. The dependent variable is the time, which changes based on the speed.
How do we determine which variable is independent in the pair of 'length of stay' and 'accommodation cost'?
-The independent variable in this case is the length of stay, as it influences the accommodation cost. The longer you stay, the higher the cost of accommodation will be.
What determines the dependent variable in the relationship between solar panel area and energy produced?
-In this case, the area of the solar panel is the independent variable, as it determines the amount of energy produced. The more extensive the panel area, the more energy will be generated.
Why is the vehicle lifespan considered the independent variable when looking at vehicle resale value?
-The vehicle lifespan is the independent variable because it directly influences the resale value of the vehicle. A longer lifespan typically leads to a lower depreciation rate, affecting the resale value.
What would happen if the independent and dependent variables were mixed up in a scatter diagram?
-Mixing up the independent and dependent variables would lead to a misleading diagram and incorrect conclusions, as the cause-and-effect relationship would be misrepresented.
How do cause-and-effect relationships play a role in identifying independent and dependent variables?
-Cause-and-effect relationships help identify independent variables as the cause and dependent variables as the effect. For example, in the relationship between speed and travel time, speed is the cause, and time is the effect.
Can there be cases where both variables are dependent on each other in a scatter diagram?
-Typically, one variable is independent and the other is dependent. However, in some complex scenarios, both variables may influence each other, but one still serves as the primary independent variable for clarity in analysis.
Why is it necessary to determine independent and dependent variables before drawing a scatter diagram?
-Determining independent and dependent variables beforehand is necessary because it ensures that the scatter diagram accurately represents the relationship between the variables, leading to meaningful conclusions and insights.
Outlines

Этот раздел доступен только подписчикам платных тарифов. Пожалуйста, перейдите на платный тариф для доступа.
Перейти на платный тарифMindmap

Этот раздел доступен только подписчикам платных тарифов. Пожалуйста, перейдите на платный тариф для доступа.
Перейти на платный тарифKeywords

Этот раздел доступен только подписчикам платных тарифов. Пожалуйста, перейдите на платный тариф для доступа.
Перейти на платный тарифHighlights

Этот раздел доступен только подписчикам платных тарифов. Пожалуйста, перейдите на платный тариф для доступа.
Перейти на платный тарифTranscripts

Этот раздел доступен только подписчикам платных тарифов. Пожалуйста, перейдите на платный тариф для доступа.
Перейти на платный тарифПосмотреть больше похожих видео

STATISTIKA Part 5 - DIAGRAM PENCAR

Menggambar Diagram Pencar Kelas XI Fase F Kurikulum Merdeka
Pengertian Diagram Pencar - Matematika Wajib SMA Kelas XI Kurikulum Merdeka

Statistik Teori pertemuan ke ~ 9 Korelasi dan Regresi

Analisis Korelasi#STIE GICI
Belajar Statistika - [Scatter Plot] Diagram Pencar (bagian 1)
5.0 / 5 (0 votes)
