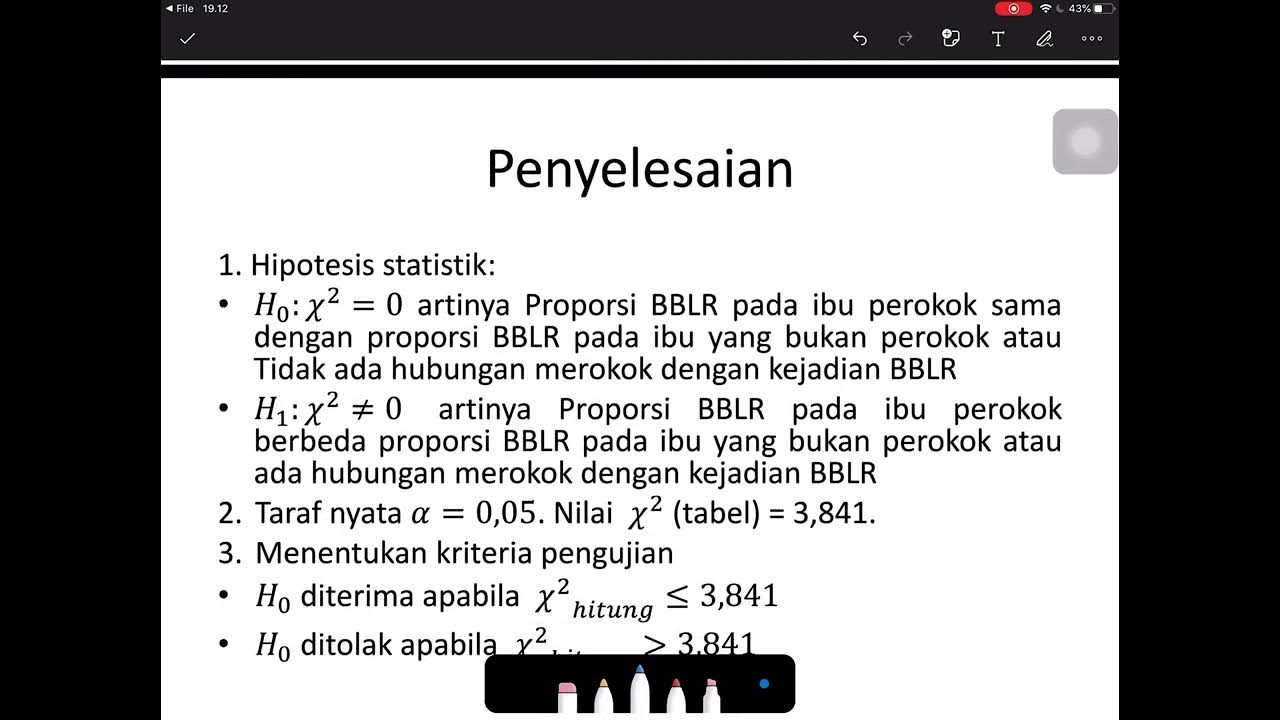
Uji Statistik Chi Square dengan tabel 2X2. cara membaca hasil uji chi square.
Summary
TLDRThis tutorial explains how to use the Chi-Square test in SPSS to analyze the relationship between sodium intake and hypertension. The process involves coding variables, preparing data, and performing the Chi-Square test, with a focus on meeting statistical assumptions such as having no expected counts below 5. The tutorial also discusses how to interpret the results, including the use of continuity correction or Fisher’s Exact Test when needed. The key finding is an odds ratio (OR) of 15.556, suggesting that individuals with high sodium intake are 15 times more likely to develop hypertension compared to those with normal intake.
Takeaways
- 😀 The script discusses how to use a 2x2 table for chi-square analysis, specifically focusing on sodium intake and hypertension in a study.
- 😀 It explains how to simplify and adjust the table by removing unrealistic categories, like sodium intake lower than 575 mg per day, based on available data.
- 😀 The script highlights the importance of coding the variables (sodium and hypertension levels) in SPSS, such as using '1' for normal and '2' for high sodium intake, and '1' for mild and '2' for moderate hypertension.
- 😀 It shows how to enter variables and coding in SPSS, including setting variable names, labels, and value codes for analysis.
- 😀 The importance of selecting the correct statistical tests, such as Chi-square, is emphasized for analyzing categorical data like sodium intake and hypertension levels.
- 😀 The tutorial explains how to configure SPSS for chi-square tests by selecting options like expected counts, row percentages, and continuity corrections.
- 😀 It explains the significance of ensuring there are no cells with a value of 0 and that the expected count for each cell is above 5 for the chi-square test to be valid.
- 😀 The script advises that if the expected count in any cell is below 5, the Fisher Exact Test should be used instead of the chi-square test.
- 😀 The outcome of the chi-square test or Fisher Exact Test helps determine if there is a significant relationship between sodium intake and hypertension.
- 😀 The script concludes that a significant relationship was found between sodium intake and hypertension, with an odds ratio of 15.556, indicating a higher risk of hypertension for those with high sodium intake.
Q & A
What is the primary purpose of using the chi-square test in this tutorial?
-The chi-square test is used to analyze the relationship between sodium intake and hypertension by comparing observed and expected frequencies in a 2x2 table.
What are the two variables being analyzed in the example provided?
-The two variables being analyzed are sodium intake (X) and hypertension (Y).
How is sodium intake categorized in this study?
-Sodium intake is categorized into two groups: 'Normal' (575 mg to 1600 mg per day, coded as '1') and 'High' (greater than 1600 mg per day, coded as '2').
What are the two levels of hypertension being examined?
-The levels of hypertension are categorized as 'Light' (systolic pressure below 160, coded as '1') and 'Moderate' (systolic pressure 160 or higher, coded as '2').
How is the data entered into SPSS for analysis?
-In SPSS, the data for sodium intake and hypertension are entered in the 'Variable View' with appropriate codes for each category, and then copied into 'Data View' for statistical analysis.
What statistical test is used to analyze the relationship between sodium intake and hypertension?
-The chi-square (k-square) test is used to analyze the relationship between sodium intake and hypertension.
Why is it important to check the 'expected count' in the chi-square test?
-It is important to check the 'expected count' because if any of the cells have an expected count below 5, the results of the chi-square test may not be valid, and Fisher's Exact Test should be used instead.
What is Fisher's Exact Test, and when should it be used?
-Fisher's Exact Test is an alternative statistical test used when the expected count in any cell of a 2x2 table is less than 5, ensuring accurate results in small samples.
How is the odds ratio (OR) interpreted in the context of this study?
-The odds ratio (OR) represents the likelihood of developing moderate hypertension in individuals with high sodium intake compared to those with normal intake. In this example, an OR of 15.556 means those with high sodium intake are 15 times more likely to develop moderate hypertension.
What does a p-value of less than 0.05 indicate in the chi-square test?
-A p-value of less than 0.05 indicates that there is a statistically significant relationship between sodium intake and hypertension, meaning the variables are likely associated.
Outlines

Этот раздел доступен только подписчикам платных тарифов. Пожалуйста, перейдите на платный тариф для доступа.
Перейти на платный тарифMindmap

Этот раздел доступен только подписчикам платных тарифов. Пожалуйста, перейдите на платный тариф для доступа.
Перейти на платный тарифKeywords

Этот раздел доступен только подписчикам платных тарифов. Пожалуйста, перейдите на платный тариф для доступа.
Перейти на платный тарифHighlights

Этот раздел доступен только подписчикам платных тарифов. Пожалуйста, перейдите на платный тариф для доступа.
Перейти на платный тарифTranscripts

Этот раздел доступен только подписчикам платных тарифов. Пожалуйста, перейдите на платный тариф для доступа.
Перейти на платный тарифПосмотреть больше похожих видео

Analisis Chi Square dengan aplikasi SPSS

Video Tutorial Cara Uji Chi Square/Chi Kuadrat dengan Program SPSS

*M* Uji Kecocokan: Frekuensi yang Diduga Sama dan yang Tidak Sama dengan Microsoft Excel dan SPSS

How to calculate a Chi-Square Test?

video 14.2. chi-square test of independence

Uji Chi Square (Contoh soal dan penyelesaian)
5.0 / 5 (0 votes)
