What is Statistics? A Beginner's Guide to Statistics (Data Analytics)!
Summary
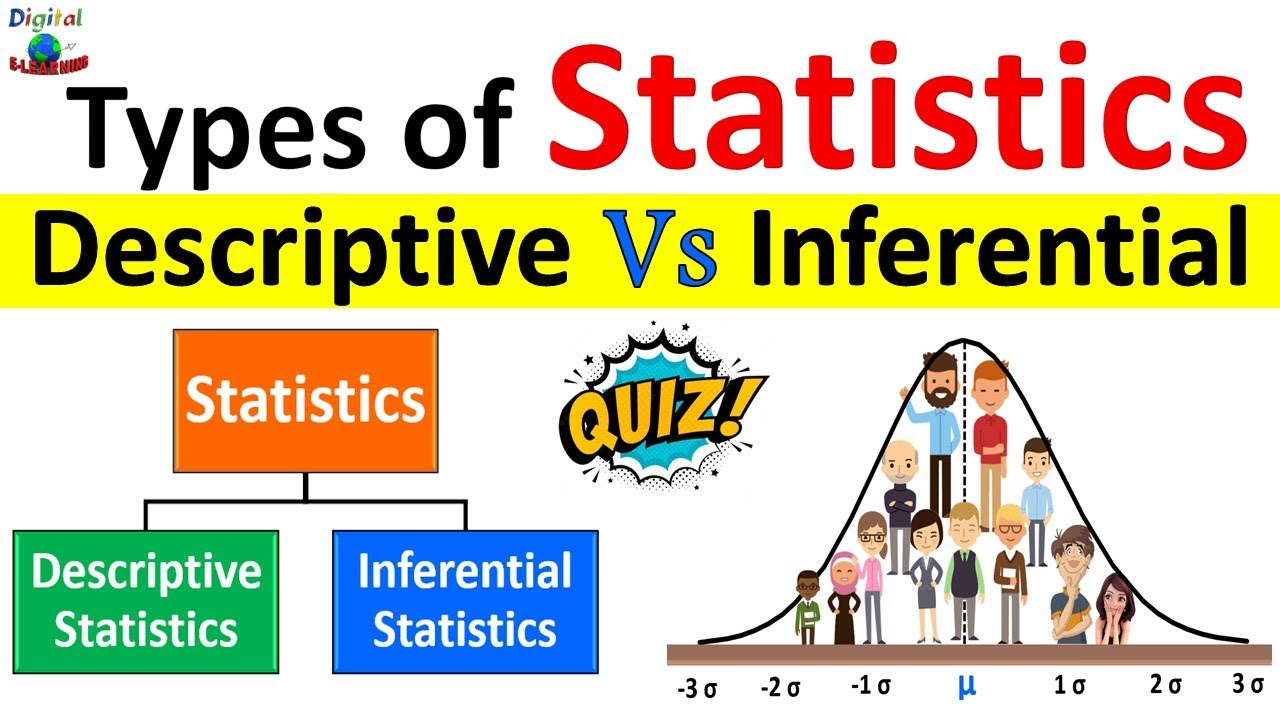
TLDRThis video provides an introduction to statistics, covering both descriptive and inferential methods. Descriptive statistics focus on summarizing and describing data, including measures like mean, median, and standard deviation. It also explores frequency and contingency tables to represent data. Inferential statistics, on the other hand, allows conclusions to be drawn about a population based on sample data. The video covers key components such as hypothesis testing, P-values, and statistical errors, helping viewers understand how data analysis can be used to make inferences and test hypotheses in various fields.
Takeaways
- 😀 The importance of fostering a supportive community in educational settings.
- 😀 Strategies for enhancing student engagement through interactive learning methods.
- 😀 The role of mentorship in guiding students toward their academic and personal goals.
- 😀 Emphasizing mental health awareness and resources available to students.
- 😀 Encouraging collaboration among students to build teamwork and communication skills.
- 😀 The impact of technology on modern education and the need for digital literacy.
- 😀 Developing resilience in students to help them navigate challenges and setbacks.
- 😀 Promoting inclusivity and diversity within the educational environment.
- 😀 The significance of continuous professional development for educators.
- 😀 Highlighting success stories of students who have thrived through supportive programs.
Q & A
What is the primary focus of statistics?
-Statistics deals with the collection, analysis, and presentation of data.
What are the two main branches of statistics discussed in the video?
-The two main branches are descriptive statistics, which summarizes and describes a dataset, and inferential statistics, which makes inferences about a population based on sample data.
How is a survey used in the context of statistics?
-Surveys collect data on variables of interest, such as gender and preferred newspaper, which can then be analyzed to identify relationships or trends.
What are measures of central tendency, and can you name them?
-Measures of central tendency describe the center of a dataset. The main measures include the mean, median, and mode.
What is the difference between the mean and the median?
-The mean is the average of all observations, while the median is the middle value when the data is arranged in order. The median is less affected by outliers compared to the mean.
What is the standard deviation, and why is it important?
-The standard deviation indicates the average distance between each data point and the mean, providing insight into how spread out the values in a dataset are.
What is the role of a frequency table?
-A frequency table displays how often each distinct value appears in a dataset, offering a concise summary of the data.
What is a contingency table?
-A contingency table analyzes the relationship between two categorical variables, showing how observations fall into different categories.
What is hypothesis testing in inferential statistics?
-Hypothesis testing is a method for testing a claim about a parameter in a population using sample data, allowing researchers to draw conclusions about the population based on the sample.
What do the terms Type I and Type II errors mean in hypothesis testing?
-Type I error occurs when a true null hypothesis is rejected, while Type II error occurs when a false null hypothesis is not rejected.
Outlines

Этот раздел доступен только подписчикам платных тарифов. Пожалуйста, перейдите на платный тариф для доступа.
Перейти на платный тарифMindmap

Этот раздел доступен только подписчикам платных тарифов. Пожалуйста, перейдите на платный тариф для доступа.
Перейти на платный тарифKeywords

Этот раздел доступен только подписчикам платных тарифов. Пожалуйста, перейдите на платный тариф для доступа.
Перейти на платный тарифHighlights

Этот раздел доступен только подписчикам платных тарифов. Пожалуйста, перейдите на платный тариф для доступа.
Перейти на платный тарифTranscripts

Этот раздел доступен только подписчикам платных тарифов. Пожалуйста, перейдите на платный тариф для доступа.
Перейти на платный тарифПосмотреть больше похожих видео

PENGERTIAN ILMU STATISTIK - STATISTIKA EKONOMI | BAB 1

KUPAS TUNTAS: Apakah Perbedaan Statistik Inferensial dengan Statistik Deskriptif ?

What is the difference between Descriptive Statistics and Inferential Statistics?

PERBEDAAN STATISTIK DESKRIPTIF DAN INFERENSIAL

Descriptive Statistics vs Inferential Statistics | Measure of Central Tendency | Types of Statistics

PERBEDAAN STATISTIKA DESKRIPTIF DAN INFERENSIAL | Dive Deeper | Algoritma 2023
5.0 / 5 (0 votes)
