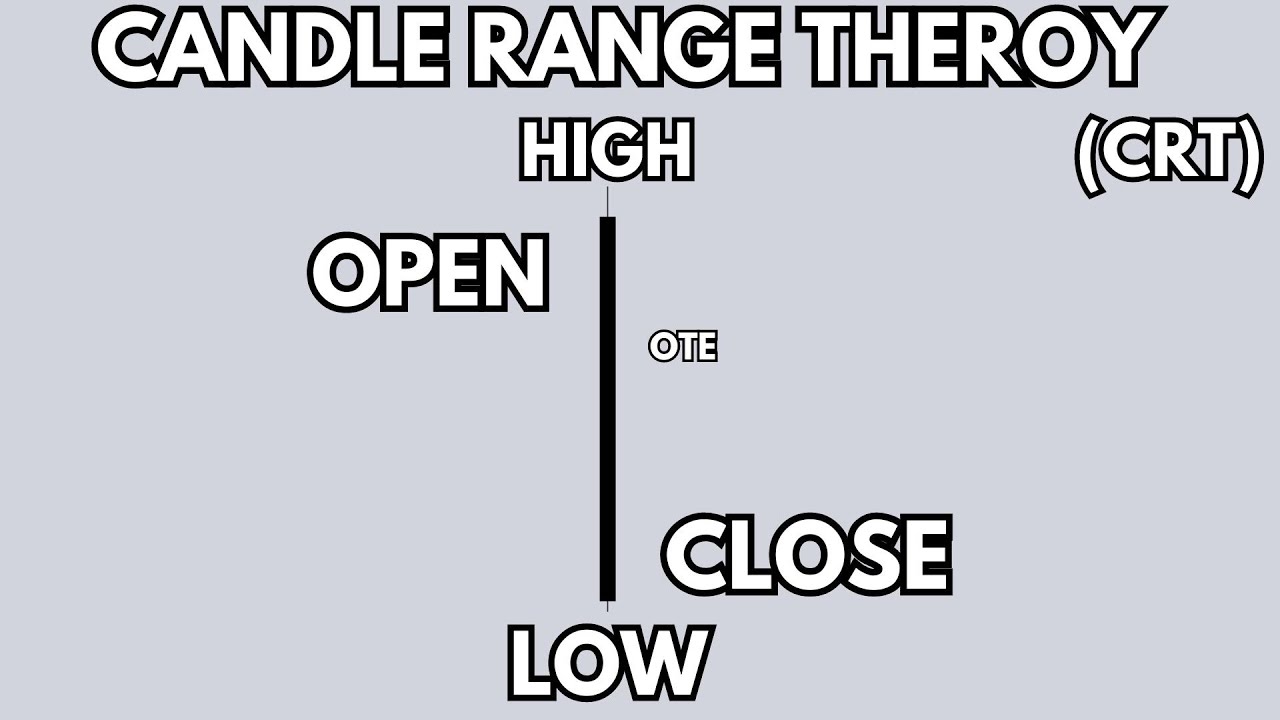
Open High Low Close - Understanding Candlesticks

TTrades
6 Aug 202414:10

Summary

TLDRThis video covers the essential concepts of candle charts used in trading, explaining how to read candles based on their open, high, low, and close prices. It distinguishes between bullish and bearish candles and discusses three key types: directional candles, reversal candles, and indecision candles. The video emphasizes the importance of analyzing the body and wicks of candles to identify price trends and reversals. Real chart examples are used to demonstrate how different candle types behave on various time frames, aiding viewers in making informed trading decisions.

Takeaways

  • 📊 Every candle in trading has an open, high, low, and close, which are essential to understanding price movements.
  • 📉 A bearish candle forms when the close is below the open, indicating downward price movement.
  • 📈 A bullish candle occurs when the close is above the open, showing upward price movement.
  • 🔍 The three main candle types are directional, reversal, and indecision candles, each reflecting different market behavior.
  • 📉 A bearish directional candle moves in one direction for most of the period, often having a small wick compared to the body.
  • 📈 A bullish directional candle trends upward for most of the period, with a relatively smaller wick compared to the body.
  • 🔄 Reversal candles show a change in direction, where the wick is larger than the body, indicating that price reversed during the time period.
  • ⚖️ Indecision candles have small bodies with longer wicks, indicating that price fluctuated but closed near the opening price, reflecting market uncertainty.
  • 🔁 Understanding how candles form on different timeframes (e.g., daily or 15-minute) can provide deeper insights into price action.
  • 🔎 Recognizing patterns like directional moves or reversals over consecutive days helps traders anticipate market behavior and adjust their strategies accordingly.

Q & A

  • What are the four key components of a candle in trading?

    -The four key components of a candle are the open, high, low, and close. These represent the opening price, the highest price, the lowest price, and the closing price within a specific time period.

  • How can you identify a bearish candle?

    -A bearish candle occurs when the closing price is below the opening price, indicating that the price moved downward during the time period.

  • How is a bullish candle defined?

    -A bullish candle is defined by the closing price being higher than the opening price, indicating that the price moved upward during the time period.

  • What is a directional candle and how can it be recognized?

    -A directional candle shows movement primarily in one direction throughout the time period. For a bearish directional candle, price opens, makes a high, and then moves lower to close. For a bullish directional candle, price opens, makes a low, and then moves higher to close.

  • What characteristics distinguish a reversal candle from other types?

    -A reversal candle has a large wick relative to its body. It shows a price reversal during the time period, meaning that the price moves in one direction and then reverses to close in the opposite direction.

  • What can a small wick relative to the body of a candle indicate?

    -A small wick relative to the body often indicates a directional candle where price movement is more stable and trends in one direction during the time period.

  • How do lower time frames relate to higher time frame candles?

    -Lower time frames contribute to the formation of higher time frame candles. For example, a daily candle might consist of smaller 15-minute candles showing the detailed movement of price throughout the day.

  • What is an indecision candle, and what does it signify?

    -An indecision candle occurs when the opening and closing prices are close to each other, with long wicks on both sides. It indicates a lack of clear direction in the market during that time period.

  • How does understanding open, high, low, and close (OHLC) improve trading?

    -Understanding OHLC helps traders interpret market behavior, identify trends, and make better decisions based on whether the price is moving upward, downward, or staying neutral within a time period.

  • What patterns might you expect after several directional candles in a row?

    -After several directional candles, such as three days of expansion, it’s common to see a reversal or consolidation, where price movement may shift direction or pause for a period of indecision.

Outlines

00:00

📊 Introduction to Candlestick Basics

This section introduces the basic components of candlesticks in trading: open, high, low, and close. It explains how the relative position of the open and close defines whether a candle is bullish or bearish. The segment also emphasizes the importance of understanding these components, as they form the foundation for various types of trading strategies.

05:01

📉 Explanation of Directional Candles

Here, the video focuses on the first type of candle, the directional candle, where price movement happens in one main direction throughout a specific time frame. Both bullish and bearish directional candles are discussed in detail, with emphasis on how the body and wicks of the candles behave, usually showing smaller wicks compared to the body.

10:02

🔄 Reversal Candles and Their Characteristics

This section delves into the second type of candle: the reversal candle. Reversal candles have larger wicks compared to the body, indicating that price moves strongly in one direction before reversing. The explanation includes how reversal candles are formed on lower time frames and how they signal a potential change in market direction.

🤔 Indecision Candles: Market Uncertainty

This part covers the final type of candle, the indecision candle. It explains that when the market opens and closes at nearly the same price, with large wicks on both sides, it signals a lack of clear direction in the market. Indecision candles suggest the market is uncertain, and this concept is illustrated using examples from different time frames.

🔍 Analyzing Market Behavior with Candles

In this section, the video dives into how different types of candles, such as directional, reversal, and indecision candles, can be used to anticipate market behavior. Examples are provided, illustrating how understanding the patterns formed by candles across different time frames helps traders make informed decisions.

📈 Applying Candlestick Patterns to Trading Strategies

This segment concludes by tying together the concepts discussed earlier, showing how traders can apply the understanding of open, high, low, and close candles to predict market movements. The importance of recognizing patterns, including periods of expansion and consolidation, is emphasized to refine trading strategies.

Mindmap

Keywords

💡Open

The 'open' refers to the price at which a security begins trading during a specified time period, such as a day, hour, or minute. In the video, the term is frequently used when explaining the structure of a candlestick in technical analysis. The open is a key point because it helps determine whether a candle is bullish or bearish based on whether the close price is above or below the open.

💡High

The 'high' represents the highest price that a security reaches during the specific time frame of the candle. It helps traders understand the peak level the price reached during that period. In the video, the high is discussed in the context of directional and reversal candles, showing how price may spike before reversing direction or continuing.

💡Low

The 'low' is the lowest price the security reaches during a given time period. It’s one of the four key points (Open, High, Low, Close) that form the structure of a candlestick. In the video, lows are particularly important in reversal and bearish directional candles, where price typically moves downward after hitting a high.

💡Close

The 'close' refers to the price at which a security stops trading at the end of a specified period, which can be crucial in determining the trend direction. If the close is below the open, it forms a bearish candle, while a close above the open creates a bullish candle. The video highlights the importance of the close in interpreting both short-term and long-term market movements.

💡Bullish Candle

A 'bullish candle' forms when the close price is higher than the open price, indicating upward price movement during the period. In the video, bullish candles are used to explain trends where the market moves in one direction, typically upward, showing buyer dominance. They are crucial in identifying upward momentum.

💡Bearish Candle

A 'bearish candle' is formed when the close price is lower than the open price, representing downward movement. The video uses bearish candles to describe situations where the market is predominantly selling, causing prices to drop throughout the time period, signaling a possible downtrend.

💡Directional Candle

A 'directional candle' is a type of candlestick where the price moves predominantly in one direction (either up or down) during the time period. The video focuses on this candle type to describe clear trends, with smaller wicks relative to the body, indicating strong, sustained price movement either upwards (bullish) or downwards (bearish).

💡Reversal Candle

A 'reversal candle' shows a change in the price direction during the time period, where the market initially moves in one direction (up or down) and then reverses to close in the opposite direction. The video explains how these candles signal potential turning points in the market, with larger wicks compared to the body, as seen in examples of both bullish and bearish reversals.

💡Indecision Candle

An 'indecision candle' occurs when the open and close prices are very close, with longer wicks on both sides, showing that neither buyers nor sellers dominated the market during the time period. The video uses this candle type to explain market uncertainty or consolidation periods, where price fluctuates but ultimately doesn't move far from the opening price.

💡Time Frames

'Time frames' refer to the different intervals (e.g., 15-minute, daily, monthly) used to analyze price movements in candlestick charts. The video frequently switches between various time frames to show how the formation of candles on shorter time frames (like 15 minutes) contributes to the structure of longer-term candles (daily or monthly), helping traders interpret trends across different time scales.

Highlights

Introduction to the video discussing Open, High, Low, Close of candles and how it applies to trading.

Definition of bearish and bullish candles based on the relation between the open and close prices.

Explanation of how every candle has an open, high, low, and close, which is essential for trading analysis.

The concept of a directional candle, where price moves in one main direction during the time period.

In a bullish directional candle, price opens, makes a low, trends higher, and closes at a high.

In a bearish directional candle, price opens, makes a high, trends lower, and closes at a low.

Smaller wicks relative to the candle body are common in directional candles.

A step-by-step walkthrough of how candles form on a lower time frame, focusing on how daily and 15-minute candles relate.

Reversal candles occur when price opens, trends in one direction, then reverses to close in the opposite direction.

A reversal candle often has a wick larger than the body, indicating significant price movement in both directions.

In the example shown, the daily candle shows price moving higher but then reversing, forming a bearish reversal candle.

Indecision candles occur when the price opens and closes close to the same level, indicating little market direction.

Examples of how indecision candles can form after a period of high volatility, where the market fails to find direction.

Discussion on the importance of recognizing patterns of three directional candles followed by either a reversal or consolidation candle.

Understanding the relationship between higher time frame candles and lower time frame movements helps traders anticipate market trends.

Transcripts

play00:05

[Music]

play00:10

how's it going everyone in this video we

play00:12

are going to be talking about the Open

play00:14

high low close and open low high close

play00:16

of candles we'll first talk about

play00:19

defining a bearish and bullish candle

play00:21

and then we'll talk about the three

play00:22

different types of candles that I focus

play00:24

on let's get into the PDF but the first

play00:27

thing you need to understand is that

play00:29

every candle has an open high low and

play00:32

close so for this specific time period

play00:35

price went and the highest at WR was up

play00:38

here making a high the lowest it went

play00:41

was down here making a low and price at

play00:44

the specific time opened right here and

play00:47

closed here so if the close is below the

play00:50

open then that is a bearish candle now

play00:53

if the open is below the close that is a

play00:56

bullish candle now every single candle

play00:59

has an open high low close and it is the

play01:01

foundation of trading let's talk about

play01:03

the three different types of candles

play01:05

that I focus on the first candle I focus

play01:07

on is a directional candle and what that

play01:09

means is price went one direction

play01:12

throughout this time period for the most

play01:14

part you can see we had an open we made

play01:17

a high and then we continued lower for

play01:20

the majority of this time period before

play01:22

making a low and closing similarly with

play01:25

a bullish candle moving in One Direction

play01:27

we had an open we made a low

play01:30

we continued in one direction for most

play01:32

of this time period made a high and then

play01:35

closed so what does this look like on

play01:37

the lower time frames well for a bullish

play01:40

directional candle we'll have an open a

play01:42

low and then we'll continue or Trend in

play01:45

one direction to make a high and then

play01:47

close and the one thing to notice is

play01:49

generally with directional candles this

play01:51

Wick is smaller relative to the body

play01:54

right it's how it's going to be now with

play01:57

a bearish directional candle we'll have

play01:59

an open we'll make a high above that

play02:01

open and we'll have a continued move

play02:04

down to then close once again a smaller

play02:07

Wick relative to the body let's hop into

play02:10

trading View and go over a few examples

play02:12

of this so here we are in trading View

play02:14

and the first candle we're going to take

play02:15

a look at is this one right here so you

play02:18

can see price opened made a high went

play02:22

lower throughout the time period and

play02:23

then closed here since the close is

play02:26

below the open it is a bearish candle

play02:28

now let's go take a look at what the

play02:30

looks like on a lower time frame so down

play02:32

here on the 15-minute chart in relation

play02:34

to the Daily candle let's see how it

play02:36

forms so the first thing we're going to

play02:38

do is go ahead and Mark out this opening

play02:40

price here at 1,800 so now that we have

play02:43

that marked out let's play this through

play02:45

and watch how the candle forms you can

play02:47

see throughout Asia we kind of

play02:49

accumulate here we make a high and then

play02:52

we get displacement down right so open

play02:55

high now if this candle's going to

play02:57

continue lower I'd like to see this high

play02:59

High left and to trade lower throughout

play03:01

the day and you can see we're trading

play03:04

lower we get New York open we go even

play03:07

lower and you can see how this move

play03:08

higher here is just to create the wick

play03:10

of this daily

play03:13

candle and there as we close the day you

play03:15

can see we had an open we made a high we

play03:20

went down we made a low and then we

play03:22

closed the candle you can see every time

play03:25

frame that has a candle there is a lower

play03:27

time frame making that candle

play03:30

on The Daily I like to use the 15minute

play03:32

time frame let's go to a few more

play03:36

examples so now if we're looking at the

play03:38

daily chart here once again and we see

play03:41

that price wretch above and then close

play03:43

back inside here what am I anticipating

play03:46

for the next day to be bearish so if I'm

play03:49

bearish then I want to see what type of

play03:51

candle well an open I low close cuz I

play03:55

want to see a one directional move down

play03:57

so do we get that we do so what does

play04:00

this look like on a lower time frame so

play04:02

you can see here this was the previous

play04:04

day here is the new day open so we want

play04:07

to see what open high low close and if

play04:11

you notice right here what do we not

play04:13

have we have an open our high is the

play04:15

exact same price as the open we don't

play04:17

currently have an upper wick on the

play04:19

daily chart as we move ahead did we just

play04:22

create the wick on the daily chart let's

play04:28

see and then we get the continuation

play04:30

lower so you can see open we made a high

play04:35

one directional move make a low and then

play04:38

close so let's continue this into the

play04:40

next day if we're still bearish what do

play04:41

we want to see open high low

play04:45

close so as we continue this ahead into

play04:49

the New York

play04:52

session what do we get we get a move

play04:55

higher sweeping these previous highs

play04:57

around equilibrium of the previous day

play05:00

and then displacement lower so open I

play05:05

we'd want to see a move lower to make a

play05:07

low and then close and here is where

play05:09

I'll use projections or something else

play05:12

to give me a projected

play05:14

move and you can see it went far beyond

play05:17

that projection we made an open high low

play05:21

let's see if we close here or where we

play05:24

go and we just close right in here

play05:28

hopefully that makes sense open high low

play05:31

close now this works on all time frames

play05:33

for instance we are now looking at the

play05:35

monthly candle using the daily chart as

play05:38

the lower time frame candles so if we're

play05:40

going to move higher we want to see what

play05:42

open low high

play05:46

close and you can see there we got our

play05:48

open low high close then we open up the

play05:52

new month and we make a move higher at

play05:55

the start and then that leads us into

play05:56

our next candle type so let's go back to

play05:58

the PDF so the next candle type I focus

play06:01

on is a reversal candle and so what this

play06:03

looks like is we have an open a high a

play06:07

low and close or an open low high close

play06:11

and what do you notice about this Wick

play06:13

relative to the body well the wick is

play06:15

larger than the body you notice how with

play06:17

the directional candle our Wick was

play06:19

smaller than the body with the reversal

play06:21

candle it is different so what's

play06:22

happening on the lower time frames here

play06:24

while we open we're making a move higher

play06:27

so it's looking like a directional

play06:29

candle up

play06:30

and in this time period we went higher

play06:32

and then price reversed all the way down

play06:34

here to then close so price went up then

play06:36

reversed or made a reversal candle

play06:39

similarly open went down looking like a

play06:42

bearish directional candle then reversed

play06:44

to make a high close if we look at this

play06:47

on a lower time frame open made a low

play06:51

was looking like expansion down price

play06:53

reversed to then make a high and close

play06:55

so open low high close with a bearish

play06:59

revers candle open high low close was

play07:04

looking like a bullish directional

play07:06

candle then price reversed so when you

play07:08

see a wick that means on a lower time

play07:11

frame price went up and then down let's

play07:14

hop into the charts and go over a few

play07:16

examples of these now back where we left

play07:18

off with our previous example on CL

play07:20

daily chart looking at the monthly open

play07:23

high low close what do we notice about

play07:25

this low here we barely made a low right

play07:27

in the single daily candle we just kind

play07:29

kind of moved higher so we have an open

play07:31

high let's see what

play07:33

happens so if you notice what happens is

play07:36

we move higher and then price reverses

play07:39

to go lower we have an aggressive move

play07:41

out of a range and an aggressive move

play07:43

back into a range let's see how this

play07:45

month

play07:46

closes and you can see we close as a

play07:50

bearish reversal candle what happens at

play07:52

the start of the next month we get an

play07:54

expansion move down off of that reversal

play07:56

now if we go back in replay what do we

play07:58

notice about our first example in the

play08:00

video this candle looks a lot like that

play08:02

monthly candle right where we have an

play08:05

expansion up price then moves open high

play08:10

low close forming a bearish reversal

play08:12

candle so then I can anticipate what a

play08:15

bearish directional candle after that so

play08:18

if we go down to the lower time frames

play08:19

here so now down here on the lower time

play08:21

frames if we watch this candle form you

play08:23

can see it's pretty choppy but what

play08:25

happens is price moves higher we make a

play08:28

high

play08:30

and then the most important part here is

play08:32

we move lower and where do we

play08:34

close we close back down here making a

play08:38

bearish reversal candle so you can see

play08:41

here price went higher reversed and then

play08:44

closed below its opening price so let's

play08:47

take another look at this example what

play08:49

happens as we near the New York session

play08:51

we get an aggressive move lower right so

play08:54

right now it's looking like open high

play08:57

low close right but this is where

play08:59

Direction bias is important because if

play09:01

I'm bullish and seeing an opposing move

play09:03

down in New York I'm thinking a New York

play09:05

reversal to make a what bullish reversal

play09:09

candle what happens here we make a low

play09:13

we get our change in the state of

play09:15

delivery and then where do we go we go

play09:18

higher so you see how this candle looks

play09:21

open low high close right where we

play09:24

finish off so let's go back to the PDF

play09:26

and talk about the last candle type I

play09:28

look for

play09:29

now the last candle type I look for is

play09:31

an indecision candle and what does that

play09:33

mean means that price opens makes a high

play09:36

or a low and then closes very close to

play09:39

the opening price so you can see how we

play09:41

have a longer wick on each side and the

play09:44

body is fairly small that means

play09:45

throughout this time period or candle so

play09:48

for instance if this is a daily candle

play09:50

it means that price really didn't go

play09:52

anywhere through that day right because

play09:54

it opened and closed relatively to the

play09:56

same price so we look at an example of a

play09:58

bullish one right here make a low make a

play10:01

high make a low but the most important

play10:03

things we open and close right next to

play10:06

each other so there's no real Direction

play10:08

in the market and similar thing here

play10:10

with a bearish indecision candle the

play10:12

open and closing prices are relatively

play10:15

close to each other making a very small

play10:17

body or not much Direction in the market

play10:20

let's go into the charts and look at a

play10:21

few examples of these so here we are on

play10:23

a gold 15minute chart and we'll be

play10:25

watching The Daily

play10:27

candle you can see as we play this

play10:30

through we don't really do a whole lot

play10:31

right we're chopping around what are we

play10:33

making a little broadening

play10:36

formation and what happens well we just

play10:38

sweep out both sides of the range so

play10:41

right now we let this come back and

play10:43

close where do we return to right around

play10:47

the opening price right so larger wick

play10:50

on each side and opening and closing

play10:52

near each other so what does that show

play10:54

there is no direction right now in the

play10:56

market it's just kind of sitting around

play10:58

so here in our next example what do we

play11:00

notice about the previous range well we

play11:03

had a very large previous range see that

play11:06

500 points on inq so with a lack of news

play11:10

or volatility following a range that is

play11:13

very large a lot of times we get an

play11:15

indecision

play11:17

candle you can see there is no real

play11:20

movement in the market and what happens

play11:23

is we just come and make a high and a

play11:25

low price can't go anywhere and we will

play11:28

end up closing closing right around the

play11:30

opening

play11:32

price if you know what a Seek and

play11:33

Destroy looks like or a broading

play11:36

formation we'll just kind of get that

play11:38

pattern right the price will take

play11:40

external go back to equilibrium with

play11:42

range so here we are on CL daily chart

play11:45

and I just wanted to explain a few

play11:46

things we went over the three candle

play11:48

types and generally I don't like to see

play11:50

more than three of those candle types in

play11:52

a row so if we're getting 3 days of

play11:54

expansion or a directional move then I

play11:56

like to see a different candle type or a

play11:58

reversal

play11:59

consolidation so let's see so you notice

play12:03

here we get 3 days of expansion right so

play12:06

open high low close open high low close

play12:10

open high low close right so the

play12:12

following day what happens well what do

play12:15

we print we sweep out previous day's low

play12:17

and close inside but more importantly

play12:20

open low on that sweep make a high and

play12:23

then close so what are we printing a

play12:26

bullish reversal candle so do we see a

play12:29

reversal well let's see the next

play12:31

days open low high close we're closing

play12:35

over this previous bar you remember my

play12:38

daily bias

play12:39

video open low high close closing over

play12:44

now do we get a third day we do open

play12:47

high low close now what happens on this

play12:49

next day following 3 days this isn't

play12:52

great expansion but three up closed

play12:55

candles we get a consolidation right so

play12:58

you see how the opening price and

play13:00

closing price are right next to each

play13:02

other see what happens well now we sweep

play13:06

previous day low into a fair value Gap

play13:08

and what do we notice about this candle

play13:10

open low high close and what is that

play13:14

forming a bullish reversal candle and in

play13:16

this case it's reversing from the

play13:18

retracement to then continue higher and

play13:21

there we get a move higher so hopefully

play13:23

that shows you how you can add it to

play13:25

other Concepts just the understanding of

play13:27

open high low close and if you go down

play13:28

to the lower time frames you kind of

play13:30

already know what they look like for

play13:32

instance here I know we opened we made a

play13:35

high back at equilibrium of the previous

play13:37

day then from there we found expansion

play13:40

lower and then we closed in the lows

play13:42

here we made a move higher to then go

play13:45

lower and close so you can kind of start

play13:47

to picture the lower time frames just

play13:50

understanding the Open high low and

play13:52

close now I hope you found this video

play13:54

helpful if you did please consider

play13:56

liking and subscribing and I'll see you

play13:57

guys in the next one have a a good one

Rate This

5.0 / 5 (0 votes)

Связанные теги
Candlestick PatternsBearish CandlesBullish CandlesTrading StrategyChart AnalysisDirectional CandlesReversal CandlesIndecision CandlesTechnical AnalysisPrice Action
Вам нужно краткое изложение на английском?