Module 1: Time vs Frequency Domains

Professor David S. Ricketts
26 Jul 201807:56

Summary

TLDRThis script explains the difference between the time and frequency domains in signal analysis. It describes how the time domain reflects real-world experiences and is represented by plots over time, while the frequency domain is more abstract, focusing on a signal's frequency components. The Fourier transform is used to convert between the two. Practical tools such as oscilloscopes and spectrum analyzers are discussed, along with the importance of understanding low-power signals and how filters affect signals in both domains. Concepts like negative frequencies and real vs. imaginary components are also explored.

Takeaways

  • 🕰️ Time domain represents the familiar way we perceive the world, where events occur sequentially over time.
  • 📊 The time domain is typically represented by a plot with time on the x-axis.
  • 🔄 The frequency domain is an abstract concept that represents signals as a sum of frequency components.
  • 🎶 Using Fourier series, any time-domain signal can be broken into cosines and sines in the frequency domain.
  • 🔢 Engineers often use frequency (F) in analysis, but sometimes work with Omega (ω) in analytical calculations.
  • 📡 Time-domain signals are measured using an oscilloscope, while frequency-domain signals are measured using a spectrum analyzer.
  • 📉 Advanced features of spectrum analyzers are necessary to detect very low-power signals like microwatts or picowatts.
  • 🔄 The Fourier transform allows conversion between time and frequency domains, but changes in one domain affect the other differently.
  • 📏 Filters in the frequency domain can simplify signal processing, smoothing signals in the time domain.
  • 🌀 Real signals contain both positive and negative frequency components, which are necessary to represent fully measurable real-world signals.

Q & A

  • What is the time domain, and why is it familiar to us?

    -The time domain is the way we perceive events as they occur in real life, where time moves forward, and events happen over time. It's familiar because it reflects our everyday experiences and is typically represented by a plot versus time.

  • How does the frequency domain differ from the time domain?

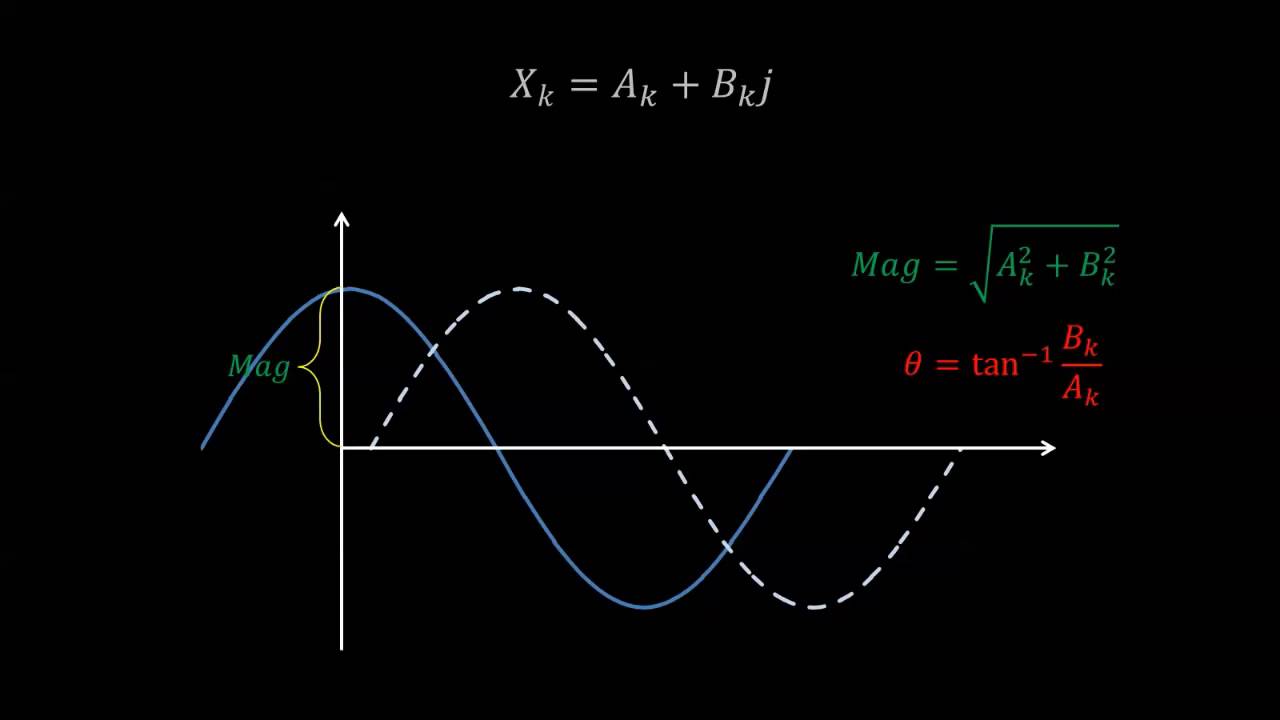
    -The frequency domain is an abstract concept that helps us analyze signals by breaking them down into frequency components, such as cosines and sines. Unlike the time domain, which deals with signals over time, the frequency domain focuses on the magnitude and phase of these frequency components.

  • What is the role of the Fourier series in signal processing?

    -The Fourier series allows us to break any time-domain signal into a series of cosines and sines. This decomposition makes it easier to work with signals by analyzing their frequency components, particularly in the frequency domain.

  • Why do engineers often use frequency (F) instead of angular frequency (Omega)?

    -Engineers commonly use frequency (F) because most instrumentation measures in terms of frequency. However, angular frequency (Omega) is used in analytical calculations, often when results are expressed in radians. Engineers can switch between the two using a conversion formula.

  • What instruments are used to measure time and frequency domain signals?

    -To measure time-domain signals, an oscilloscope is used. For frequency-domain signals, a spectrum analyzer is employed. Both instruments provide valuable insights into the respective domains of the signals.

  • How can you move between the time and frequency domains?

    -The Fourier transform allows for the conversion of signals from the time domain to the frequency domain and vice versa. Changes in one domain affect the other, although the changes are not identical.

  • What happens to a signal when it passes through a low-pass filter?

    -In the frequency domain, a low-pass filter removes high-frequency components, which correspond to sharp edges in the time domain. As a result, the signal becomes smoother in the time domain.

  • What does the Fourier transform of a square wave look like?

    -The Fourier transform of a square wave produces a sinc function in the frequency domain. This transform illustrates how a square wave, with sharp edges in the time domain, contains a wide range of frequency components.

  • What are real and negative frequencies, and how are they related?

    -In the frequency domain, real signals have both positive and negative frequency components. Negative frequencies appear due to the complex nature of signals, which can be expressed as a combination of e^(jωt) and e^(-jωt). These components help create a real signal by canceling out the imaginary parts.

  • Why do we need both positive and negative frequency components to form a real signal?

    -To form a real signal, we combine both positive and negative frequency components because a single component would result in a complex (imaginary) signal. Combining them cancels the imaginary parts and ensures the signal is entirely real and measurable.

Outlines

00:00

⏳ Understanding the Time and Frequency Domains

This paragraph explains the concept of the time domain, which is how we perceive events in everyday life, represented as plots versus time. It introduces the frequency domain as a more abstract way to represent signals by breaking them into sine and cosine components, referencing the Fourier series. These components are plotted in terms of frequency or phase to analyze signals. The paragraph also discusses how engineers use both the frequency (F) and angular frequency (Ω), noting that these can be interchanged with proper conversion.

05:03

📊 Measuring Time and Frequency Domains

This section describes the instruments used to measure signals in the time and frequency domains. It introduces the oscilloscope, which represents the time domain, and the spectrum analyzer, which handles frequency domain measurements. The paragraph highlights that while oscilloscopes are more familiar, spectrum analyzers are key for measuring low-power signals such as microwatts and picowatts in radio systems. The advanced features of spectrum analyzers are necessary for detecting these small signals.

🔄 Fourier Transform: Linking Time and Frequency Domains

The paragraph discusses how the Fourier transform allows transitions between the time and frequency domains, noting that changes in one domain reflect differently in the other. It introduces the idea of filtering signals in the frequency domain (e.g., using a low-pass filter) and the corresponding smoothing effect in the time domain. This provides an example of how certain tasks are easier to understand in the frequency domain, while there is always an equivalent change in the time domain to consider.

📐 Understanding Sinusoids and Delta Functions

This section focuses on the Fourier transform of sinusoids, explaining how a cosine wave corresponds to two delta functions in the frequency domain. The concept of negative frequency is introduced, which results from the Fourier transform of a cosine, yielding both positive and negative components. The paragraph clarifies that real signals have both positive and negative frequencies and discusses the mathematical identity (e^jωt) that helps illustrate why these dual components are needed to form a real signal.

Mindmap

Keywords

💡Time Domain

The time domain refers to how signals are perceived in everyday life, where events are tracked over time. In the video, it is explained as the familiar way of plotting signals, typically as a function of time, and is measured using devices like oscilloscopes.

💡Frequency Domain

The frequency domain represents an abstract way of analyzing signals based on their frequency components rather than time. It breaks signals down into sines and cosines, allowing engineers to view the magnitude and phase of each frequency. In the video, it is compared to the time domain and measured using a spectrum analyzer.

💡Fourier Transform

The Fourier Transform is a mathematical operation that converts a time-domain signal into its frequency-domain equivalent. The video explains that using Fourier transforms, a signal's characteristics can be studied in both domains, showing how modifications in one domain affect the other.

💡Oscilloscope

An oscilloscope is a device used to measure and visualize signals in the time domain. In the video, the oscilloscope is introduced as a standard tool for examining how signals vary over time, with the time axis clearly represented on the screen.

💡Spectrum Analyzer

A spectrum analyzer is a device used to measure and display signals in the frequency domain. The video demonstrates how this tool is crucial for analyzing the frequency components of a signal, especially in fields like radio systems where low-power signals must be detected.

💡Low-Pass Filter

A low-pass filter allows low-frequency components of a signal to pass through while attenuating higher frequencies. The video uses this filter to illustrate how filtering a signal in the frequency domain has an equivalent effect of smoothing the signal in the time domain.

💡Sinc Function

The sinc function is the Fourier transform of a square wave. The video explains how certain time-domain waveforms, such as square waves, result in sinc functions when transformed into the frequency domain, demonstrating the relationship between shapes in the two domains.

💡Cosine Wave

A cosine wave is a fundamental periodic signal composed of a single frequency component. The video describes how a sinusoid or cosine wave appears as a single tone in the frequency domain, represented by a delta function.

💡Negative Frequency

Negative frequency refers to the mirrored frequency component of a real signal in the frequency domain. In the video, it is explained that all real signals possess both positive and negative frequency components, a necessary feature for generating a purely real signal.

💡Real and Imaginary Components

Real and imaginary components refer to the parts of a complex number or signal, with the imaginary part often representing a phase shift. The video differentiates between real, measurable signals and the use of imaginary components in mathematical representations like in-phase and quadrature signals.

Highlights

The time domain is what we experience in everyday life, where time moves forward, and it is typically represented as a plot versus time.

The frequency domain is an abstract concept used to represent signals by their frequency components, making signal analysis more robust.

The Fourier series allows any time waveform to be broken into a series of cosines and sines, which make up the signal in the frequency domain.

In engineering, we often represent frequency by 'F', though 'Omega' is commonly used in analytical calculations, as it represents radians.

We measure signals in both time and frequency domains using instruments like the oscilloscope for the time domain and spectrum analyzers for the frequency domain.

Oscilloscopes plot signals against time, while spectrum analyzers plot the magnitude of each frequency, helping analyze even low-power signals.

The Fourier transform converts signals between the time and frequency domains, showing the correlation between changes in one domain and the other.

A low-pass filter in the frequency domain filters out unwanted frequencies and smooths out the signal in the time domain.

Operating in the frequency domain can simplify complex signal processing tasks that are harder to visualize in the time domain.

A sinusoid is considered a 'single tone' because it contains a single delta function in the frequency domain, with both positive and negative frequency components.

Real signals have both positive and negative frequency components, often referred to as images in the frequency domain.

The negative frequency component comes from the Fourier transform of cosine, which introduces a -J Omega T term.

To obtain a completely real signal, two components, e^jΩt and e^-jΩt, must be combined to cancel out the imaginary part.

This combination of e^jΩt and e^-jΩt results in either a cosine or sine wave, creating a real signal without imaginary components.

Real signals in the lab can be measured using instruments, and the frequency domain representations allow engineers to filter and analyze these signals efficiently.

Transcripts

play00:05

so the time domain is what we think

play00:07

about and we perceive in our everyday

play00:10

life so in our world time marches

play00:13

forward and we think about things

play00:14

happening over time and so the time

play00:18

domain is very comfortable and familiar

play00:21

to us and typically is represented by a

play00:24

plot versus time not much to say in here

play00:29

but if we think about the other domains

play00:32

we work with namely the frequency domain

play00:34

this is a little bit different the

play00:36

frequency domain is an abstract concepts

play00:38

that we've generated that really helps

play00:40

us deal with signals in a more robust

play00:43

way and these are representing the

play00:45

signals by the frequency components that

play00:47

make them up if you remember from the

play00:50

Fourier series that you could take any

play00:53

time waveform and break it up into a

play00:56

series of cosines and sines and the

play00:58

frequency domain just simply plots the

play01:01

magnitude and phase of those cosines and

play01:05

sines that when you add up create the

play01:07

time domain signal that you are

play01:09

interested in and we generally represent

play01:11

this in F or we can also talk about

play01:15

Omega typically as engineers we talk

play01:18

about F because all of our

play01:19

instrumentation is in frequency directly

play01:23

Omega is used quite often because

play01:26

oftentimes analytical calculations end

play01:28

up in radians and a make is more useful

play01:30

so we can go back and forth between the

play01:32

two almost interchangeably the only

play01:35

thing you need to make sure of is that

play01:37

if you're doing a calculation it may

play01:39

likely be in terms of Omega and if you

play01:42

want to convert to F you need to use the

play01:44

formula right here

play01:47

all right so the question comes in if we

play01:50

have time domain is what we see in real

play01:52

life if you will in frequency domain is

play01:54

this concept how do we measure these two

play01:56

and so you should know that there's two

play02:00

primary instruments that we're going to

play02:01

use to measure time and frequency domain

play02:04

so let's start with the time domain

play02:09

and this is a picture of an old

play02:12

oscilloscope but you probably already

play02:14

know that we use the escola scope here

play02:16

to represent the time domain and so the

play02:20

time axis is actually right right here

play02:23

and then of course if we want to do the

play02:25

frequency domain we use a spectrum

play02:28

analyzer where this axis right here is

play02:30

in terms of F and these are simply plots

play02:33

of the magnitude of each frequency then

play02:36

we're going to learn to use both of

play02:37

these it's expected that you probably

play02:39

already know how to use an oscilloscope

play02:40

and we're going to go over some of the

play02:42

basic functionality of a spectrum

play02:45

analyzer and also go into some of its

play02:47

advanced features because one of the

play02:49

things about radio systems is that we

play02:51

deal with signals of very low magnitude

play02:53

and our very low power so microwatts

play02:56

maybe even pico watts and it turns out

play02:59

that we have to use some of these

play03:00

advanced features in order to be able to

play03:01

see these really small signals so we'll

play03:03

talk about that more as time comes along

play03:06

alright now we've been talking about the

play03:09

time versus frequency domain and as you

play03:11

know we can go between those two using

play03:14

the Fourier transform and so the Fourier

play03:16

transform will take us from a time

play03:18

domain signal into a frequency domain

play03:20

signal as you know and just as a

play03:26

reminder if you change a signal in one

play03:28

domain it gets changed in the other

play03:30

domain however the change is not the

play03:33

same if we change this signal here X of

play03:37

Omega does change but the change happens

play03:39

to the Fourier transform so except for

play03:41

linear multiplications by scalars

play03:44

changing X of T for instance shifting in

play03:47

time does not just simply shift that on

play03:50

the axis but this should be review for

play03:52

you and so here is a couple examples of

play03:57

Fourier transforms and one of the things

play03:59

we want to show you here is sort of how

play04:04

things look in the time domain and how

play04:05

things look in the frequency domain so

play04:08

if you remember the Fourier transform of

play04:10

a square ends up with a sinc function

play04:14

here and you're probably familiar with

play04:14

that if we were though to take a

play04:17

low-pass filter and I'll draw that in

play04:20

the frequency domain so imagine I put in

play04:21

a filter

play04:22

that has a passband like this so it's

play04:27

pretty easy and intuitive from the

play04:29

frequency domain to realize we're just

play04:31

gonna basically filter out all these

play04:33

sides and this is the signal we get but

play04:36

you need to remember that in the time

play04:37

domain it has an equivalent one and it

play04:40

smooths it out and we could have

play04:42

actually thought about this directly in

play04:44

that a low-pass filter is going to

play04:45

remove all the sharp edges and smooth

play04:48

things out so here's a great example of

play04:50

how operating in the frequency domain

play04:53

here is very easy and quick but there is

play04:56

an equivalent time domain change that we

play04:58

just need to keep in mind all right so

play05:03

I've shown on the left a a time domain

play05:06

waveform and on the right its Fourier

play05:08

transform and just to be accurate here I

play05:13

know that this right here is a cosine

play05:15

because it has two positive Delta

play05:18

functions so I would need to set my zero

play05:21

for instance right here to make this

play05:24

exactly accurate and so we often say

play05:28

that a sinusoid is a single tone because

play05:30

it contains a single Delta function in

play05:33

the frequency domain and we also need to

play05:36

remember that all real signals have a

play05:38

negative frequency component as well are

play05:40

sometimes called an image and so

play05:43

whenever you look at the frequency

play05:45

domain you should always see the image

play05:47

if it's a real signal now I should just

play05:50

be real careful by real here we mean we

play05:53

can measure it

play05:56

in the lab

play06:01

okay i specify that because we're gonna

play06:04

be talking a little bit later about real

play06:06

and imaginary components in terms of

play06:10

in-phase and quadrature and that just

play06:12

has to do with the fact that we're using

play06:14

imaginary to represent a 90 degree phase

play06:16

shift but those are both signals we can

play06:19

measure in the lab so real here is more

play06:20

of just realistic or stuff we can

play06:22

measure in the lab as opposed to real

play06:24

and imaginary so I want to talk a little

play06:28

bit more about this negative frequency

play06:30

if you actually did the Fourier

play06:32

transform of cosine you would see that

play06:36

one of the coefficients comes out and it

play06:38

has a minus J Omega T component and

play06:41

that's what gives us this delta function

play06:43

another way that I think helps me

play06:46

remember two things one is what this is

play06:49

and also that we need both is this

play06:53

identity here you probably remember if

play06:55

you think about these is plotting e to

play06:59

the J Omega T and this is e to the minus

play07:02

J Omega T right we know that e to the J

play07:06

Omega T is cosine Omega T plus J sine

play07:10

Omega T so if I just had one of these

play07:12

this is what I would get I'd get a real

play07:15

part and I'd get an imaginary part so I

play07:18

wouldn't have a completely real signal

play07:20

if I want a completely real signal what

play07:22

I need to do is combine two of these

play07:24

either for a cosine or a sine and what

play07:27

that does is it creates either a cosine

play07:32

or a sine and removes the imaginary

play07:34

component so if you think about this

play07:36

plot simply as a

play07:42

e to the J Omega plot it helps me out a

play07:45

little bit and remembering why I need

play07:47

both it's because I need this to be real

play07:49

and that we can think about a cosine

play07:52

here simply as these two components

play07:54

right there

Rate This

5.0 / 5 (0 votes)

Связанные теги
Time DomainFrequency DomainFourier TransformSignal ProcessingOscilloscopeSpectrum AnalyzerEngineering ToolsLow-Pass FilterRadio SystemsSignal Measurement
Вам нужно краткое изложение на английском?