Comparing a Tableau report to a database using QuerySurge
Summary
TLDRThis video tutorial demonstrates how to use QuerySurge to validate the data in a Tableau report. The presenter navigates through a Tableau server to access an 'Economy' report, focusing on validating negative inflation rates. They compare the data displayed in the report to the backend database using a query pair in QuerySurge, which includes a source query connecting to the data mart and a target query connecting to the Tableau server. The tutorial guides viewers on configuring the 'tableau report' function with the correct report and visualization names from Tableau. The process concludes with running the query pair to validate and compare the data, identifying a discrepancy in the inflation rate for 1938 between the database and the report.
Takeaways
- 🌐 The video demonstrates how to use QuerySurge to validate the contents of a Tableau report.
- 📊 The report in focus is an economy report displaying ESPY economic indicators with a focus on years with negative inflation rates.
- 🔍 To validate the data, the presenter shows how to download the data from Tableau and compare it with the backend database.
- 📝 The video explains the setup of a query pair in QuerySurge, which includes a source query and a target query.
- 💾 The source query connects to a data mart and retrieves years with negative inflation rates, while the target query connects to Tableau Server.
- 🔗 The 'tableau report' function in the target query requires the report name and visualization name from the Tableau instance URL.
- ⚙️ The target query uses a 'CAST' function to match the data format from Tableau, which returns data in string format.
- 🆚 The validation process compares the data from the source and target queries to check for discrepancies.
- 🚫 The video identifies a failure in the validation process for the year 1938, highlighting a discrepancy between the backend database and the Tableau report.
- 🔧 The presenter suggests taking the identified discrepancy back to the development team for further investigation.
Q & A
What is the main purpose of the demonstration in the video?
-The main purpose of the demonstration is to show how to use QuerySurge to validate the contents of a Tableau report, specifically to check for any negative inflation rates.
How does the presenter access the Tableau report for demonstration?
-The presenter accesses the Tableau report by navigating to a browser that connects to the Tableau server and then brings up a specific report called 'economy'.
What visual indicator in the report represents negative inflation rates?
-Negative inflation rates in the report are represented by red bars in the visualization.
What action does the presenter take to view the data behind the graph in Tableau?
-The presenter clicks the 'Download' button in Tableau and then clicks the 'Data' button to view the data behind the graph.
What are the two components of a query pair in QuerySurge?
-A query pair in QuerySurge consists of a source query and a target query.
What does the source query in QuerySurge connect to?
-The source query connects to the data mart, which is the database that stores the information represented by the Tableau report.
How does the presenter configure the target query in QuerySurge to connect to Tableau?
-The presenter configures the target query to connect to the Tableau server and uses a function called 'tableau report' with parameters for the report and visualization names.
What information is required for the 'tableau report' function in QuerySurge?
-The 'tableau report' function requires the report name and the visualization name from the Tableau instance.
How does the presenter identify the report and visualization names in Tableau?
-The presenter identifies the report name by taking the portion of the URL after the server that specifies the report name, and the visualization name by copying the sheet name from the 'Rename' option in the Tableau interface.
What does the presenter do to investigate a discrepancy found during the validation process?
-The presenter investigates the discrepancy by viewing the query results, analyzing the failure, and comparing the data from the backend system with the report's display.
What is the final step the presenter suggests after identifying a discrepancy?
-The final step suggested is to take the discrepancy back to the development team to track down and resolve the issue.
Outlines

Этот раздел доступен только подписчикам платных тарифов. Пожалуйста, перейдите на платный тариф для доступа.
Перейти на платный тарифMindmap

Этот раздел доступен только подписчикам платных тарифов. Пожалуйста, перейдите на платный тариф для доступа.
Перейти на платный тарифKeywords

Этот раздел доступен только подписчикам платных тарифов. Пожалуйста, перейдите на платный тариф для доступа.
Перейти на платный тарифHighlights

Этот раздел доступен только подписчикам платных тарифов. Пожалуйста, перейдите на платный тариф для доступа.
Перейти на платный тарифTranscripts

Этот раздел доступен только подписчикам платных тарифов. Пожалуйста, перейдите на платный тариф для доступа.
Перейти на платный тарифПосмотреть больше похожих видео

Getting Started With Using Maps In Tableau | Tableau Maps For Beginners | Data Deep Dive

How to Install Tableau and Create First Visualization | Tableau Tutorials for Beginners

Belajar HTML Dari Nol Sampai Mahir | Untuk Pemula | Elemen Form Input Email
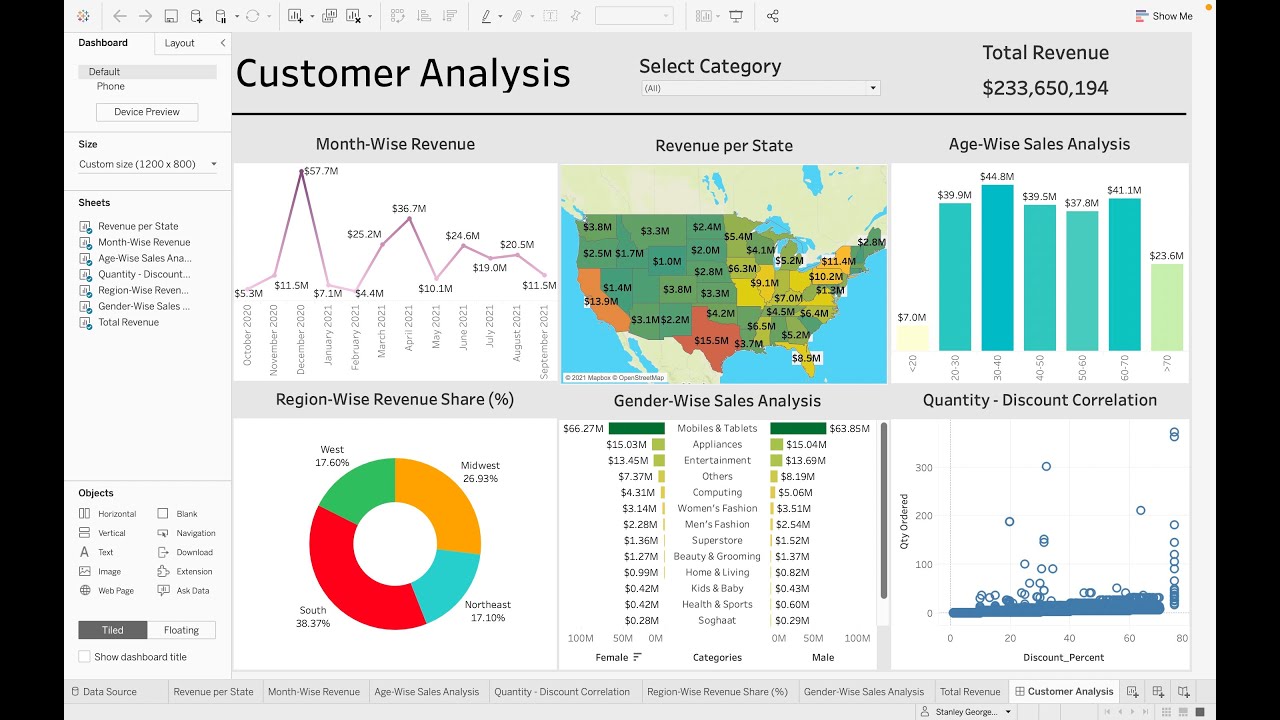
Customer Analysis using Tableau - Dashboard From Scratch

Dream Report: Acquiring Data from SQL Server
Tableau Dashboard Tutorial dalam 12 Menit | Bahasa Indonesia
5.0 / 5 (0 votes)
