ICT Silver Bullet Strategy - No Daily Bias | With Backtest!
Summary
TLDRThis video tutorial focuses on the 'Silver Bullet' trading strategy during the AM session, specifically utilizing the NQ ticker. The presenter outlines a framework based on the high and low of the 9:00 AM candle, aiming for entries between 10 and 11 AM. The strategy involves identifying price movements that take one side of the range and provides examples using TradingView and FX Replay for backtesting. The video concludes with analytics, showcasing a 44.4% return over 45 days with an average risk-to-reward ratio of about five, enticing viewers interested in day trading techniques.
Takeaways
- 🎯 The video focuses on the 'Silver Bullet' trading strategy, specifically during the AM session using the NQ ticker.
- 🕒 The strategy is confined to a specific time window, 10 to 11 a.m., for potential entries based on the AM session's price action.
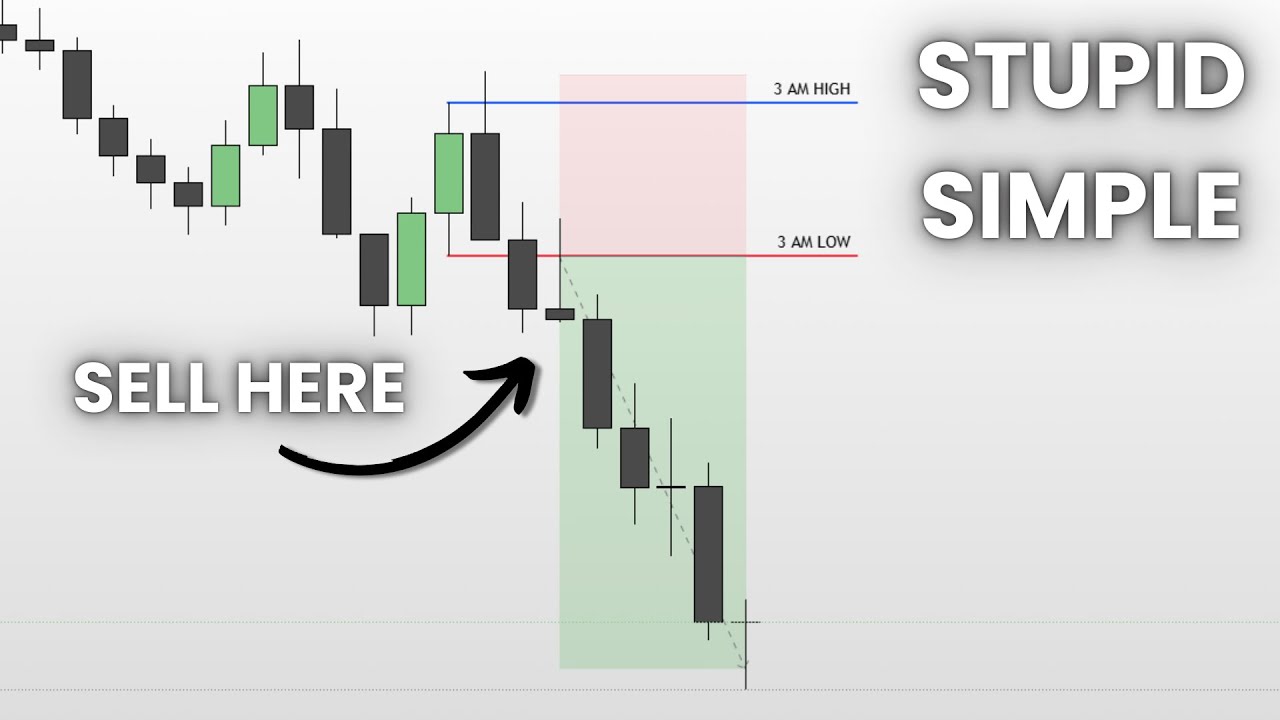
- 📈 A framework is used involving the previous hour's high and low (9:00 a.m. candle) to set the range for potential reversals and entries.
- 📊 TradingView and FX Replay are the platforms used for demonstrating examples and backtesting the strategy.
- 🚫 Entries are only considered if they occur within the 10 to 11 a.m. window; otherwise, the trader will not look for trades.
- 📉 The strategy involves looking for price action that either breaks the high or low of the 9:00 a.m. candle and then targeting the opposite side of the range.
- 📝 Stop losses are set at the high or low of the entry candle, and targets are on the other side of the range, aiming for a risk-reward ratio.
- 🔄 The importance of observing price action for 'displacement' and 'structure' before taking a trade is emphasized for better trade setups.
- 📉 The video includes a detailed backtest using FX Replay, showing the strategy's performance over a period in July and part of August.
- 📈 The backtest results show a significant return with an average risk-reward ratio of about 5, highlighting the strategy's aggressive nature.
- 📊 The analytics section of the video provides insights into the average trade duration, number of trades, and performance by month, demonstrating the strategy's profitability over the tested period.
Q & A
What is the main focus of the video?
-The video focuses on the 'Silver Bullet' trading strategy, specifically during the AM session, using the NQ ticker.
What time window is the 'Silver Bullet' strategy applied in the AM session?
-The 'Silver Bullet' strategy is applied between 10:00 AM and 11:00 AM.
How does the presenter use the previous candle's high and low to frame reversals?
-The presenter uses the high and low of the previous hour's candle (9:00 AM) to frame potential reversals and identify entry points.
What is the significance of the 10:00 AM to 11:00 AM window in the strategy?
-This window is crucial as it is the only time the presenter looks for entries in the 'Silver Bullet' strategy.
What is the role of the 'session indicator' in the strategy?
-The 'session indicator' helps mark out the range between the high and low of the 9:00 AM candle and the 10:00 AM to 11:00 AM window on the chart.
How does the presenter determine entry points in the strategy?
-Entry points are determined when the price takes one side of the range (either the high or the low of the 9:00 AM candle) and attempts to break through it within the 10:00 AM to 11:00 AM window.
What is the purpose of marking out the high and low of the 9:00 AM candle?
-Marking out the high and low of the 9:00 AM candle helps in identifying potential reversal points and setting targets for the trades.
How does the presenter use the 'fair value gap' and 'breaker' in the strategy?
-The presenter uses the 'fair value gap' and 'breaker' as potential entry points, looking for aggressive displacements and price actions that confirm the direction of the trade.
What is the significance of the '3R' rule in the strategy?
-The '3R' rule is used to move the stop loss to break even once the trade has reached three times the risk, which helps in managing risk and securing profits.
How does the presenter backtest the 'Silver Bullet' strategy in FX Replay?
-The presenter backtests the strategy by creating a strategy named 'Silver Bullet AM session', setting a $100,000 balance, choosing the NASDAQ 100 CFD, and testing from July to the current date.
What are the performance statistics presented in the video?
-The presenter shows that over 45 days and 15 trades, the strategy achieved a 23.5% return in July and 16.93% in August, with an average trade duration of about an hour and 29 minutes.
Outlines

Этот раздел доступен только подписчикам платных тарифов. Пожалуйста, перейдите на платный тариф для доступа.
Перейти на платный тарифMindmap

Этот раздел доступен только подписчикам платных тарифов. Пожалуйста, перейдите на платный тариф для доступа.
Перейти на платный тарифKeywords

Этот раздел доступен только подписчикам платных тарифов. Пожалуйста, перейдите на платный тариф для доступа.
Перейти на платный тарифHighlights

Этот раздел доступен только подписчикам платных тарифов. Пожалуйста, перейдите на платный тариф для доступа.
Перейти на платный тарифTranscripts

Этот раздел доступен только подписчикам платных тарифов. Пожалуйста, перейдите на платный тариф для доступа.
Перейти на платный тарифПосмотреть больше похожих видео

2 Minute Trading Strategy
STOP Using ICT & Trade With This Strategy Instead.. (Stupid Simple)

Supertrend Indicator Strategy with VWAP Crossover | Chartink Screener for Intraday Trading #intraday
How To Use The ICT MMXM Model In 2024 (Refined)

ICT Silver Bullet With The Most Powerful Entry (Backtesting Results)

ICT Mentorship 2023 - Evolving ICT Silver Bullet Example
5.0 / 5 (0 votes)
