How To Use The ICT MMXM Model In 2024 (Refined)
Summary
TLDRIn this video, the creator shares their detailed approach to trading using the Marker Maker X model for 2024. Drawing inspiration from ICT's top-down method, the video walks viewers through a structured trading strategy, utilizing multiple timeframes (weekly, daily, 4-hour, 1-hour, 15-minute, and 5-minute) and key concepts such as PD arrays, market structure shifts, and time elements like Silver Bullet and kill zones. The creator also emphasizes aligning with market order flow, providing examples of both bullish and bearish scenarios, as well as showing practical applications of their model for successful trading.
Takeaways
- 😀 The Marker Maker X model is a structured trading approach based on multiple timeframes and aligning with market order flow.
- 😀 A top-down analysis is essential, starting from high timeframes (weekly, daily) and drilling down to lower timeframes (4-hour, 1-hour, 15-minute) for entry confirmation.
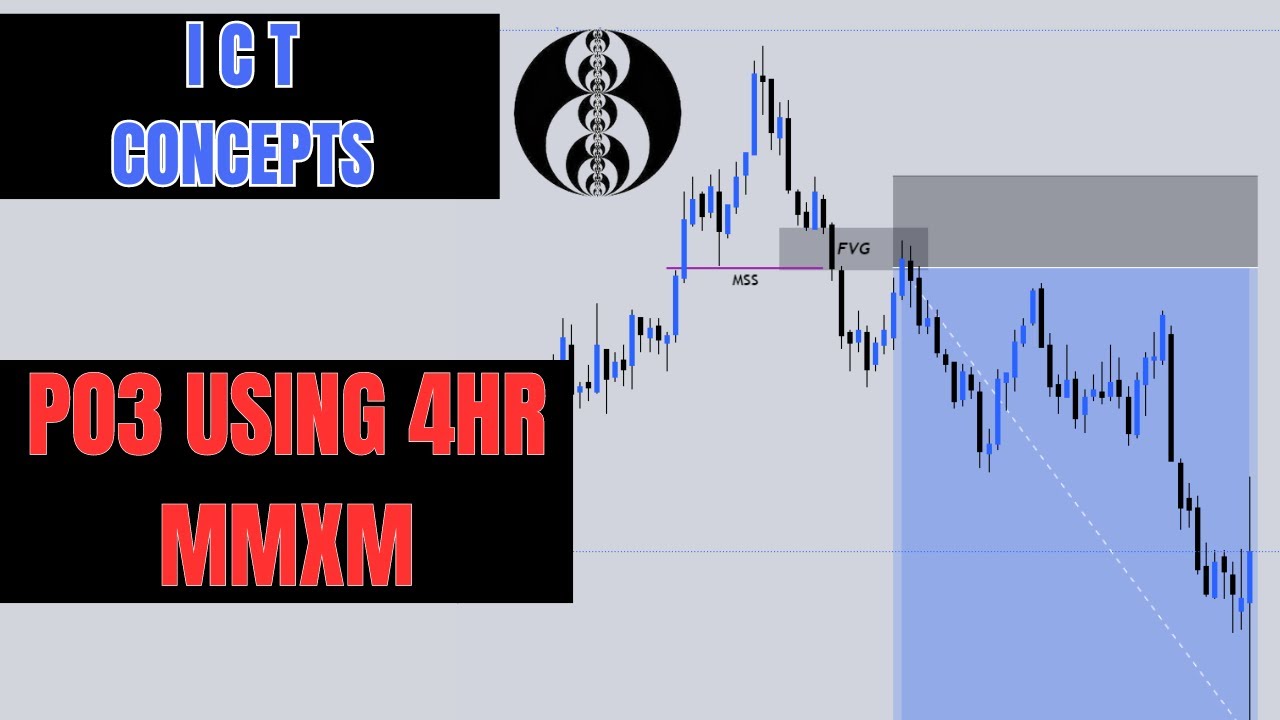
- 😀 PDAs (Price Delivery Arrays) are key to identifying critical price levels, such as buy-side or sell-side imbalances.
- 😀 The Three PDA Rule is a core part of the strategy, where trades are exited or adjusted if three key PDAs are broken.
- 😀 Time elements, such as the Silver Bullet (8:00-9:00 AM) and macro kill zones (8:52-9:10 AM), are used to pinpoint ideal trade setups.
- 😀 The trader focuses on aligning with the higher timeframe trend and only enters trades when the lower timeframes confirm the setup.
- 😀 Market structure shifts or changes in the state of delivery act as confirmation signals for entering trades.
- 😀 The strategy prioritizes simplicity, with a focus on high-probability setups, market structure shifts, and PDAs alignment.
- 😀 Trade examples demonstrate how to use a combination of higher timeframe PDAs and lower timeframe structure shifts to time entries accurately.
- 😀 Risk management includes using stop-loss levels, adjusting them to break-even when profits are reached, and cutting losses when the market goes against the setup.
- 😀 The strategy also emphasizes the importance of exiting early if the market condition becomes uncertain, and re-entering on more favorable setups.
Q & A
What is the Marker Maker X model, and how is it used in trading?
-The Marker Maker X model is a trading strategy that combines various ICT concepts to identify optimal trade entries and exits. It focuses on analyzing multiple timeframes, identifying PD arrays (Price Delivery Arrays), market structure shifts, and using time elements to enhance the probability of successful trades.
What are PD arrays, and why are they important in this trading method?
-PD arrays (Price Delivery Arrays) refer to key price levels or zones that represent a shift in market structure, such as order blocks or imbalance areas. They are crucial because they help identify areas of potential market reversal or continuation, aiding traders in making more informed decisions.
How does the process of time frame pairing work in this model?
-Time frame pairing involves aligning higher and lower timeframes to refine trade setups. For example, a trader may start with a weekly or daily chart to identify the overall market bias, then move down to the 4-hour or 1-hour chart to find specific trade setups and confirmation, and finally use smaller timeframes like the 15-minute or 5-minute for precise entries.
What role do liquidity and kill zones play in the Marker Maker X model?
-Liquidity refers to areas where large buy or sell orders are likely to accumulate, which often leads to price movement. Kill zones are specific times of day where liquidity is often more volatile, such as the ICT-defined 'Silver Bullet' or specific macro times. These elements are used to time entries and exits more effectively.
What is the significance of the '3 PD rule' in this trading strategy?
-The '3 PD rule' helps traders stay aligned with the market's order flow. If three significant PD arrays (such as order blocks or imbalance zones) are broken in the opposite direction, it signals a shift in market sentiment, and the trader should exit or adjust their position to minimize risk.
How do market structure shifts influence trade decisions in this model?
-Market structure shifts indicate a change in the direction of the market. When a structure shift occurs, such as breaking a key high or low, it confirms that the market has changed its delivery, either signaling a reversal or continuation, which serves as confirmation for entering or exiting a trade.
What is the difference between an 'inversion' and an 'order block' in this method?
-An 'inversion' refers to a change in price action that signals a reversal in market direction, while an 'order block' is a price zone where a significant price move originates. Both represent key levels that indicate shifts in market sentiment, though inversions are typically more dynamic and order blocks are often more defined.
Why does the author prefer using time elements like the Silver Bullet and macro times?
-Time elements like the Silver Bullet (a time window from 8:30 to 9:00 AM) and macro times (like 8:52 to 9:10 AM) help pinpoint when the market is most likely to experience volatility and significant price movement. By focusing on these times, traders can align their entries with market shifts and avoid less predictable periods.
How does the author manage risk when using the Marker Maker X model?
-Risk is managed by using the '3 PD rule' and time elements. If three PD arrays are broken or the market structure shifts significantly, the trader will exit the trade to avoid further risk. Additionally, the use of stop-losses and taking profits at key levels helps minimize potential losses while securing gains.
What is the logic behind the trade idea process shown in the video?
-The trade idea process begins by identifying a bias from a higher timeframe (like daily or weekly) and finding key PD arrays that align with this bias. The trader then looks for confirmation through smaller timeframes, using structure shifts, inversions, and market conditions like kill zones to time the entry and exit. The goal is to align with the dominant market order flow and execute trades when probabilities are in the trader’s favor.
Outlines

This section is available to paid users only. Please upgrade to access this part.
Upgrade NowMindmap

This section is available to paid users only. Please upgrade to access this part.
Upgrade NowKeywords

This section is available to paid users only. Please upgrade to access this part.
Upgrade NowHighlights

This section is available to paid users only. Please upgrade to access this part.
Upgrade NowTranscripts

This section is available to paid users only. Please upgrade to access this part.
Upgrade NowBrowse More Related Video

ICT MMXM - My Secret Way to Read Market Maker Moves for Beginners

How to trade Market Maker Models - A Deep Dive (ICT Concepts)

ICT Market Maker Model - Live Trade Explanation
4HR PO3 | MMXM | Standard Deviations | ICT Concepts

Step-by-step blueprint to optimize your trading strategy in under 5 mins

How to BACKTEST PROPERLY | ICT Concepts (6 Steps)
5.0 / 5 (0 votes)