How To Create A Forecast Model In Power BI With Python
Summary
TLDRThis tutorial demonstrates how to create a forecast in Power BI using Python, enhancing the built-in forecasting feature to capture both seasonal patterns and trends in data. The video guides through using exponential smoothing in a Jupyter notebook, adjusting for seasonality and trends, and integrating the Python model's predictions back into Power BI. It highlights the advantage of optimizing models in Python over Power BI's default settings and encourages further learning through additional resources.
Takeaways
- 📊 The tutorial demonstrates how to create a forecast in Power BI using Python to enhance the built-in forecasting feature.
- 🔍 The script identifies seasonality and trend in the data, which are important for an accurate forecast model.
- 📈 Power BI's forecasting feature can visually forecast data with seasonality and trend, but Python can offer more customization.
- 🤖 The use of Python allows for the implementation of models like exponential smoothing, which can be adjusted for seasonality and trends.
- 📝 The script explains the process of decomposing a time series to understand the underlying trend and seasonality.
- 📚 There are different models available for forecasting, such as additive and multiplicative trends, which can be optimized for better predictions.
- 🔧 The tutorial walks through the process of training a model using a subset of the data to prevent overfitting.
- 📅 The forecast model can predict data for a specific period, such as 30 days in advance, which is demonstrated in the script.
- 🔄 The process of integrating the Python forecast model with Power BI is shown, including adjusting the data and appending forecasts.
- 🛠 The tutorial highlights the advantage of using Python for more detailed model optimization compared to Power BI's built-in tools.
- 📘 Additional resources like webinars and further learning materials are available for those interested in deepening their knowledge on forecasting.
Q & A
What is the main topic of the video script?
-The main topic of the video script is how to create a forecast in Power BI using Python, specifically focusing on handling seasonality and trends in the data.
What type of data is being analyzed in the script?
-The data being analyzed in the script is page views, which shows some peaks and a weekly seasonality pattern along with an increasing trend in the last month.
How does Power BI's forecasting feature handle seasonality?
-Power BI's forecasting feature can visually forecast data and automatically picks up seasonality. Users can adjust the seasonality by adding a specific number, such as seven for weekly seasonality.
What is the significance of the 95% confidence intervals in the forecast?
-The 95% confidence intervals in the forecast provide a range within which the actual values are likely to fall, indicating the reliability of the forecast.
Why is the trend line turned on in the visual?
-The trend line is turned on to identify and incorporate the upward trend in the data into the forecast model, which is not being picked up well by the Power BI model alone.
What Python library is used for the exponential smoothing model in the script?
-The script uses the 'statsmodels' library for the exponential smoothing model, specifically the Holt-Winters method.
What does the term 'additive' refer to in the context of the trend in the exponential smoothing model?
-In the context of the trend, 'additive' refers to a model where the trend component is added to the data in a linear fashion, as opposed to a 'multiplicative' trend, which grows exponentially.
How does the script handle the training of the exponential smoothing model?
-The script trains the model on a subset of the data, specifically the first 290 days out of 298, to prevent overfitting and allow the model to learn effectively.
What is the purpose of the 'seasonal_periods' parameter in the exponential smoothing model?
-The 'seasonal_periods' parameter is used to define the length of the seasonal cycle in the data, which is set to seven days in the script to match the weekly seasonality.
How does the script implement the forecast in Power Query?
-The script implements the forecast in Power Query by creating a new custom column for the forecast, appending the forecast data to the original dataset, and ensuring that the columns match for easy comparison.
What are the advantages of using Python for forecasting over Power BI's built-in feature?
-Using Python for forecasting allows for more optimization of the model by adjusting the nature of the trend and seasonality, and it enables the inclusion of detailed predictions directly into the actual dataset.
Outlines

このセクションは有料ユーザー限定です。 アクセスするには、アップグレードをお願いします。
今すぐアップグレードMindmap

このセクションは有料ユーザー限定です。 アクセスするには、アップグレードをお願いします。
今すぐアップグレードKeywords

このセクションは有料ユーザー限定です。 アクセスするには、アップグレードをお願いします。
今すぐアップグレードHighlights

このセクションは有料ユーザー限定です。 アクセスするには、アップグレードをお願いします。
今すぐアップグレードTranscripts

このセクションは有料ユーザー限定です。 アクセスするには、アップグレードをお願いします。
今すぐアップグレード関連動画をさらに表示

NEXT LEVEL KPI CARD using NO CUSTOM VISUALS // Power BI Tips and Tricks in 2023
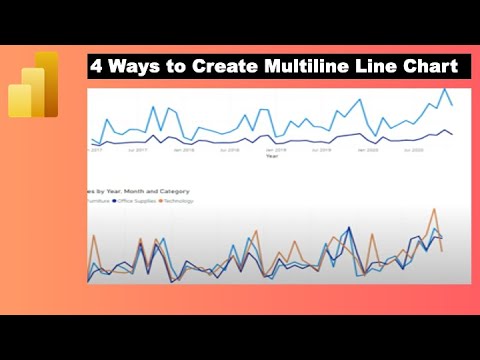
How to Create Multiple Lines in Power BI Line Chart with Dimension or Measure

Dasar Dasar Power BI | Pembuatan Dashboard Covid-19 Indonesia

Time Series Forecasting with XGBoost - Use python and machine learning to predict energy consumption
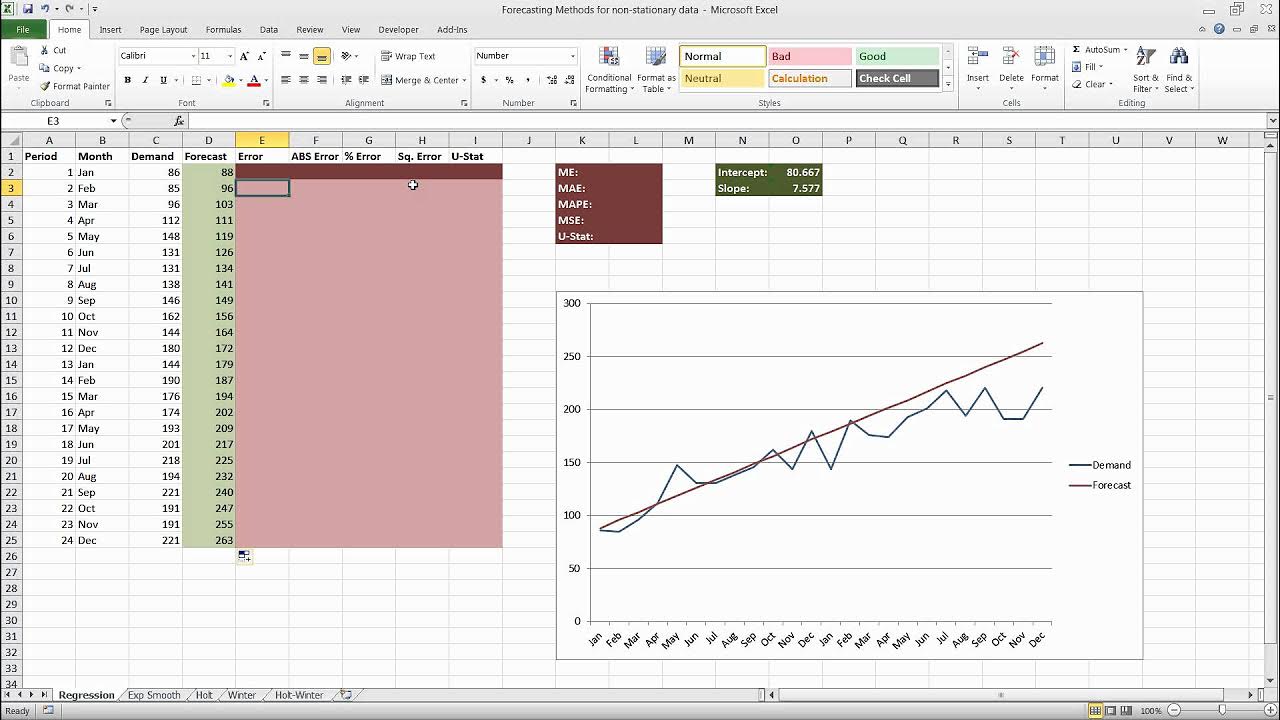
Forecasting in Excel Using Simple Linear Regression

Power BI Desktop for Beginners | Step-by-Step Guide
5.0 / 5 (0 votes)
