uji hipotesis rata-rata 2 populasi (sampel independen)
Summary
TLDRThis video script from the 'kuliah statistik' channel dives into the fourth type of hypothesis test: the two-sample t-test for independent samples. It discusses the decision-making process based on the type of hypothesis test, including one-tailed and two-tailed tests, and the use of Z-statistics and T-statistics depending on whether the population standard deviations are known. The script also covers the formulae for calculating test statistics, the importance of variance equality, and provides examples of applying these tests to real-world scenarios, such as comparing the average strength of two types of packaging or the effect of substrate concentration on chemical reaction rates. The channel invites viewers to subscribe, like, comment, and share for more statistical lessons.
Takeaways
- 📚 The lecture discusses the fourth type of hypothesis test, specifically the two-sample t-test for independent samples' means.
- 🗣️ The decision-making process for hypothesis testing depends on the type of test conducted, with the null hypothesis often stating that the difference between the two population means is zero or a specific value.
- 🔍 The alternative hypothesis can be one-sided or two-sided, indicating whether the difference between the two means is not equal to zero or greater/less than a certain value.
- 📉 In the case of a known population standard deviation, the Z-test statistic is used with a formula that includes the sample means and the hypothesized difference.
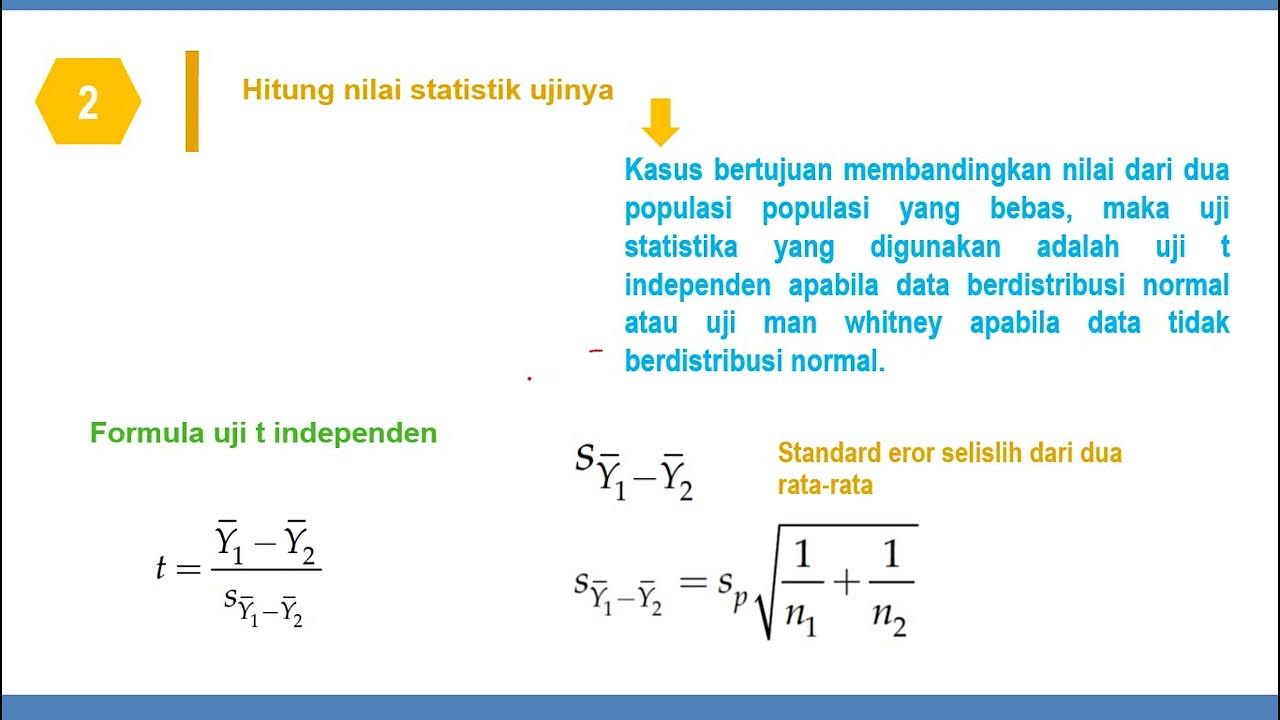
- 📈 When the population standard deviation is unknown, the t-test statistic is used, which is divided into two scenarios based on whether the variances of the two populations are assumed to be equal or not.
- 📊 For the t-test, when the variances are assumed to be equal, the combined sample standard deviation is used in the formula, calculated with the individual sample variances and sizes.
- 📐 If the variances are not assumed to be equal, a different t-test formula is used with its own degrees of freedom calculation.
- 🧐 Before choosing the t-test formula, a test for equal variances (F-test) may be conducted with its own null and alternative hypotheses and critical value comparison.
- 📘 An example problem from a statistics textbook is used to illustrate the process of hypothesis testing, including determining the hypotheses, calculating the test statistic, and comparing it with the critical value.
- 🔢 The script provides detailed steps for conducting hypothesis tests, including determining sample sizes, means, standard deviations, and significance levels.
- 🔄 The importance of understanding whether to use a one-tailed or two-tailed test is highlighted, as it affects the rejection region and the critical values used in the test.
Q & A
What is the topic of the lecture?
-The lecture is about hypothesis testing, specifically the two-sample t-test for comparing the means of two independent populations.
What are the null and alternative hypotheses for a two-tailed test?
-The null hypothesis (H0) states that the difference between the two population means is equal to a specific value (D0), while the alternative hypothesis (Ha) states that the difference is not equal to D0.
What is the significance of the critical value in hypothesis testing?
-The critical value is used to determine whether to reject the null hypothesis. If the test statistic exceeds the critical value, the null hypothesis is rejected.
What is the difference between a one-tailed and a two-tailed test?
-A one-tailed test checks if the sample mean is greater or less than the population mean in one direction, while a two-tailed test checks for differences in both directions.
When can we use the Z-test statistic?
-The Z-test statistic can be used when the population standard deviations are known.
What is the formula for the Z-test statistic?
-The Z-test statistic formula is (X1 - X2 - D0) / (sqrt((Sigma1^2 / n1) + (Sigma2^2 / n2))), where X1 and X2 are the sample means, D0 is the hypothesized difference, Sigma1 and Sigma2 are the population standard deviations, and n1 and n2 are the sample sizes.
When should we use the T-test statistic instead of the Z-test?
-The T-test statistic should be used when the population standard deviations are not known.
What is the purpose of the F-test in hypothesis testing?
-The F-test is used to test the equality of variances between two populations before performing a T-test, especially when the assumption of equal variances is in question.
What is the difference between the T-test for equal variances and the T-test for unequal variances?
-The T-test for equal variances assumes that the two populations have the same variance, while the T-test for unequal variances does not make this assumption and uses a different formula to calculate the test statistic.
How is the decision made to reject or not reject the null hypothesis in a T-test?
-The decision is made by comparing the calculated T-test statistic with the critical value at the given significance level. If the T-test statistic is greater than the critical value, the null hypothesis is rejected.
What is the significance level used in hypothesis testing?
-The significance level (alpha) is the probability of rejecting the null hypothesis when it is true. It is used to determine the critical value for the test statistic.
Can you provide an example of how to apply the T-test in a real-world scenario based on the script?
-An example given in the script is a company claiming that the average strength of a new product is at least 12 kg more than its predecessor. The T-test is used to compare the average strengths of the two products with a significance level of 0.05.
What is the conclusion of the example problem regarding the company's claim about product strength?
-The conclusion is that there is enough evidence to reject the null hypothesis, suggesting that the company's claim about the new product having a higher average strength by at least 12 kg is supported by the data.
Outlines

このセクションは有料ユーザー限定です。 アクセスするには、アップグレードをお願いします。
今すぐアップグレードMindmap

このセクションは有料ユーザー限定です。 アクセスするには、アップグレードをお願いします。
今すぐアップグレードKeywords

このセクションは有料ユーザー限定です。 アクセスするには、アップグレードをお願いします。
今すぐアップグレードHighlights

このセクションは有料ユーザー限定です。 アクセスするには、アップグレードをお願いします。
今すぐアップグレードTranscripts

このセクションは有料ユーザー限定です。 アクセスするには、アップグレードをお願いします。
今すぐアップグレード5.0 / 5 (0 votes)


