EPANET Tutorial 02.07 - Running a Single Period Analysis | Hydraulic Modeling
Summary
TLDRIn this tutorial, Mark Wilson, founder of Akimoto, guides viewers through running a single period analysis in the EPANET user's manual, section 2.7. He demonstrates how to execute the analysis, troubleshoot if necessary, and review results both graphically and tabularly. Wilson explains how to interpret negative flow values and hints at the next tutorial on extended period analysis. Viewers are encouraged to subscribe for more modeling insights.
Takeaways
- 😀 The speaker, Mark Wilson, is the founder of Akimoto and specializes in hydraulic modeling.
- 📘 The tutorial is part of a series that aligns with the EPANET user's manual, specifically section 2.7 on running a single period analysis.
- 🛠️ The tutorial assumes that the network has been built and is ready to run with sufficient data and settings.
- 🔑 The 'Run' button is used to execute the network analysis, and any issues would be flagged for troubleshooting.
- 📊 Results can be viewed graphically or tabularly in the browser's map view, with options to change note display.
- 🌈 Nodes and links can be color-coded to represent pressure and flow, with legends provided for easy interpretation.
- 🎯 Clicking on legends allows them to be toggled on and off, and they can be managed through the view settings.
- 🔍 Tabular results can be filtered using a query to limit the displayed data, providing a more focused analysis.
- 🔄 Negative flow values indicate that the flow direction is opposite to the digitized pipe direction.
- 📈 The 'Graph' button will be useful after running an extended period analysis, which will be covered in a subsequent video.
- 📝 The tutorial concludes with an invitation to subscribe to the channel, like the video, and visit the website for modeling assistance.
Q & A
Who is the speaker in the video and what is his role?
-The speaker is Mark Wilson, the founder of Akimoto, a company that specializes in hydraulic modeling.
What is the main topic of the video tutorial?
-The main topic of the video tutorial is running a single period analysis in the EPANET user's manual, section 2.7.
What is the first step in running the analysis according to the tutorial?
-The first step is to build the network and ensure there is enough data and settings for it to run successfully.
How does one initiate the analysis in the software?
-One initiates the analysis by clicking on the 'Run' button in the software.
What happens if the software encounters an issue during the run?
-If there is an issue, the software will notify the user so that they can troubleshoot the problem.
How can results be viewed in the software?
-Results can be viewed both graphically and tabularly in the software's browser and map view.
What does changing the note display to pressure do in the map view?
-Changing the note display to pressure colors the nodes according to their pressure levels and displays a legend.
How can one make the legends disappear or reappear in the map view?
-One can double-click on the legends to make them disappear and reappear by going to the 'view node view legends link' in the view settings.
What does a negative flow value in the links table indicate?
-A negative flow value indicates that the flow is going in the opposite direction to the one digitized for that pipe.
What feature is mentioned as not being useful until an extended period analysis is run?
-The 'graph' button is mentioned as not being useful until an extended period analysis is run.
What is the speaker's final call to action for viewers interested in hydraulic modeling?
-The speaker encourages viewers to subscribe to the channel, like the video if they found it beneficial, and visit the company's website for help with their modeling efforts.
Outlines
📚 Introduction to Hydraulic Modeling Tutorial
Mark Wilson, the founder of Akimoto, introduces a tutorial series that complements the EP Annette user's manual, specifically focusing on section 2.7 which deals with running a single period analysis. The tutorial guides viewers through the process of testing their network model by running it and checking for successful execution. It also touches on troubleshooting in case of errors.
📊 Viewing Results Graphically and Tabularly
After a successful run, the tutorial explains how to view the results of the hydraulic modeling in both graphical and tabular formats. It describes how to change the display settings in the map view to visualize pressure and flow at nodes and links, using color coding and legends for easy interpretation. The video also mentions how to manipulate these legends and how to switch between different views for a comprehensive analysis.
🔍 Analyzing Data with Queries and Filters
The script continues with instructions on how to analyze the model's results in a tabular format by selecting specific columns and using queries to filter the data. This allows for a detailed examination of nodes and links, including demand, head pressure, and quality. The tutorial points out the absence of initial quality settings and how to interpret negative flow values, which indicate flow in the opposite direction of the digitized pipe.
🚀 Preparing for Extended Period Analysis
Towards the end of the tutorial, Mark Wilson mentions the 'graph' button, which will be useful in the next video when an extended period analysis is conducted. He encourages viewers to subscribe to the channel, like the video, and visit the Akimoto website for further assistance with their modeling efforts, wishing them good luck in their modeling endeavors.
Mindmap
Keywords
💡Akimoto
💡Hydraulic Modeling
💡EP annette
💡Single Period Analysis
💡Run Button
💡Browser
💡Map View
💡Legend
💡Nodes
💡Links
💡Negative Flow
💡Extended Period Analysis
Highlights
Introduction to the tutorial by Mark Wilson, founder of Akimoto, focusing on hydraulic modeling.
Correlation of the tutorial with EP Annette User's Manual, specifically section 2.7 on running a single period analysis.
Importance of having a well-built network with sufficient data and settings for successful analysis.
Demonstration of how to initiate a run by clicking the 'Run' button and troubleshooting if necessary.
Explanation of how to view results graphically or tabularly using the browser in map view.
Guidance on changing note display to view pressure and flow with corresponding legends.
Instruction on how to make legends disappear and reappear for better visualization.
Method to view results in a tabular format by selecting nodes or links.
Discussion on viewing nodes with associated demand, head, pressure, and quality.
Clarification on the absence of initial quality settings or data in the current analysis.
Exploration of viewing link results and customizing the grid with chosen columns.
Introduction of the query feature to limit results and apply filters to the data.
Observation of negative flow values indicating flow direction opposite to digitized pipe direction.
Mention of the 'Graph' button's utility in extended period analysis, to be covered in the next video.
Encouragement for viewers to subscribe to the channel and like the video for beneficial content.
Invitation to visit Akimoto's website for assistance with modeling efforts.
Closing remarks wishing good luck to viewers in their modeling endeavors.
Transcripts
hello folks my name is Mark Wilson and
I'm the founder of Akimoto
where we inspire confidence and
hydraulic modeling this is another
tutorial in a series that goes along
with the EP annette user's manual this
one will correspond with user's manual
section 2.7 running a single period
analysis so now that we've built our
network hopefully we've got enough data
in there and settings that it will run
so we can test that out by clicking on
the Run button and luckily everything is
good if not it would let us know and we
can troubleshoot it but we're gonna just
run with it with our successful run here
and check out the results ok so how do
we look at results we can do it
graphically or tabular Lee over here in
our browser in the map view we can
change our note display we can look at
pressure you notice that when we do that
the nodes get colored and we get a
legend up over here we can also do the
same thing with links we'll look at flow
and get a legend up egg over here we can
double click on these legends to make
them disappear we can also make them
reappear by going here in our view node
view legends link if we want to look at
our results tabular Lee all we have to
do is click the table button and then we
choose whether we want to look at nodes
or links we're going to look at links
first there we go
there's all of our nodes with associated
demand head pressure and quality we're
now in equality because we didn't set up
any initial quality settings or data
let's just look at links real quick and
you can take her around with what gets
what
shows up in the grid by choosing columns
and then you can also do a query to
limit the results thereby they call it a
filter okay we're just gonna look at all
the links and here we go we see
something interesting here though a
couple of these links have a negative
flow what does that mean that just means
that the flow is going opposite to the
direction we digitized that pipe so
that's all the negative flow number
means we have a graph button here but
that won't be useful until we run an
extended period analysis which we'll do
in the next video so that's all for now
go ahead and subscribe to the channel if
you haven't already please like this
video if you thought it was beneficial
and visit us on our website if you'd
like some help with your modeling
efforts otherwise good luck in your
modeling
関連動画をさらに表示
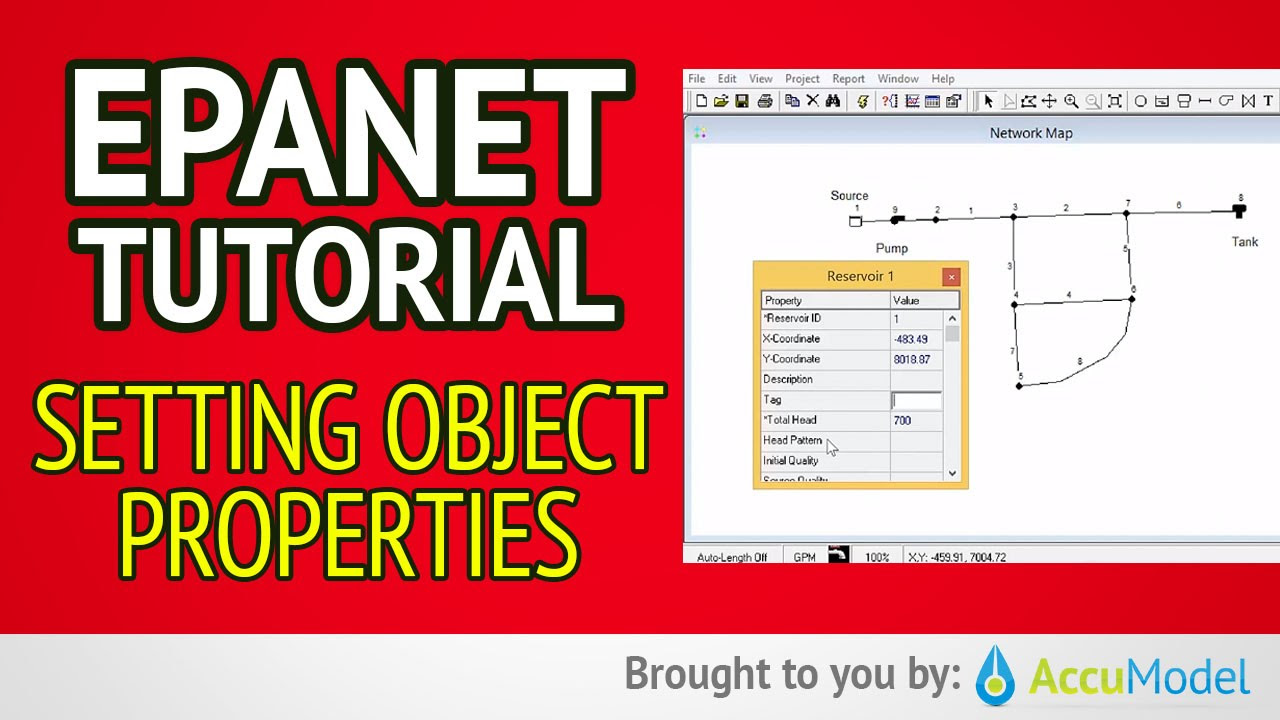
EPANET Tutorial 02.05 - Setting Object Properties | Hydraulic Modeling
EPANET Tutorial 02.03 - Project Setup | Hydraulic Modeling
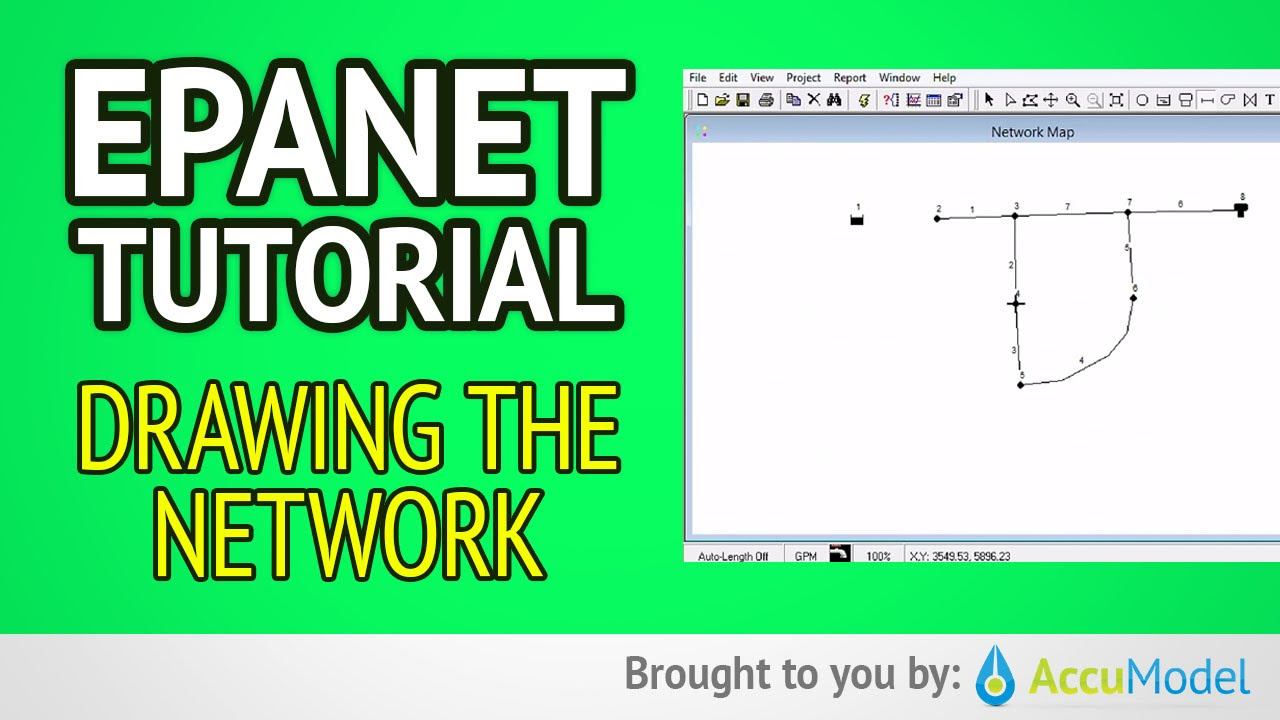
EPANET Tutorial 02.04 - Drawing The Network | Hydraulic Modeling
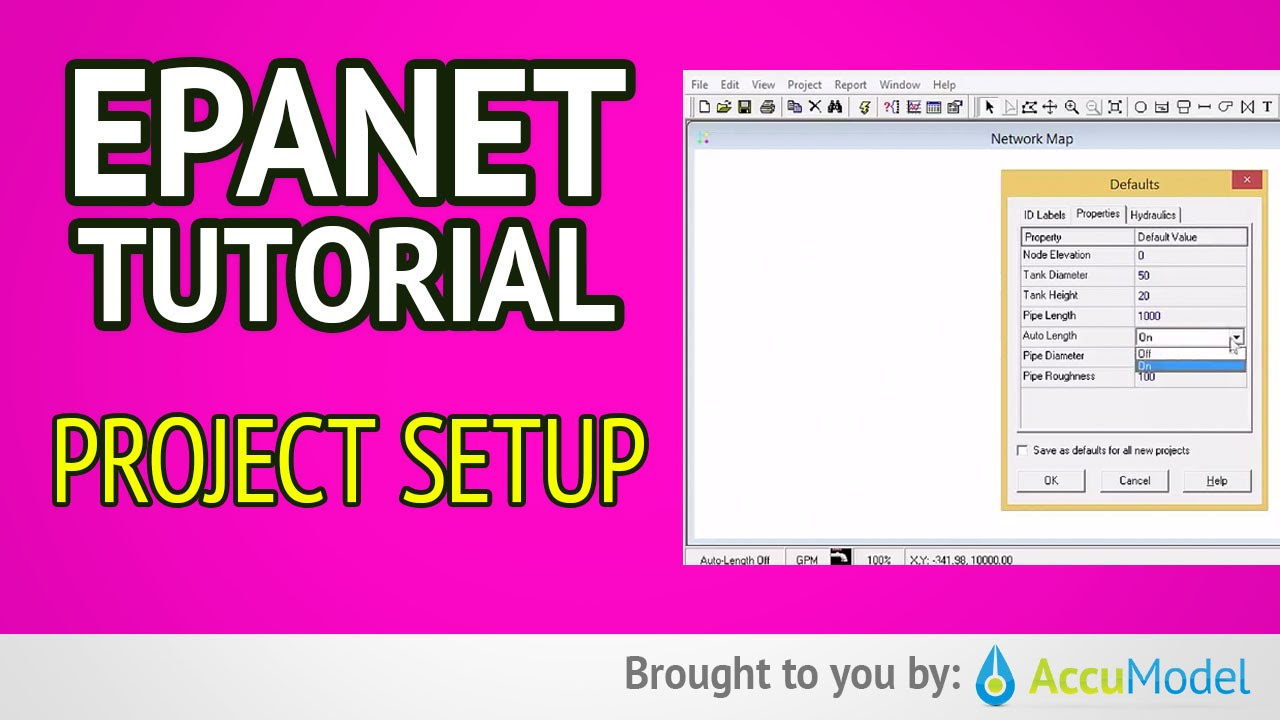
Load Flow Analysis Using ETAP Lesson (5) for Power System Engineering Courses
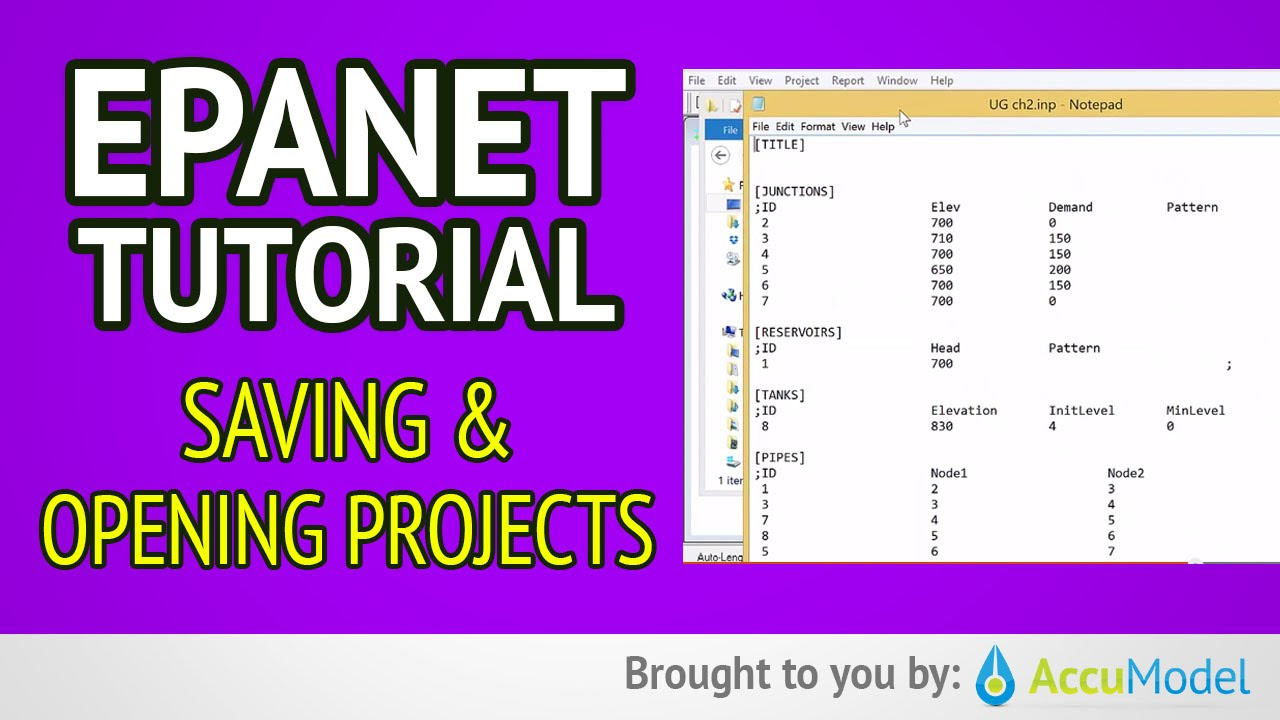
EPANET Tutorial 02.06 - Saving and Opening Projects | Hydraulic Modeling
Analisis Statistik Deskriptif dengan SPSS beserta Interpretasinya
5.0 / 5 (0 votes)