Statistical Significance versus Practical Significance
Summary
TLDRThis script explores the distinction between statistical and practical significance in hypothesis testing. It explains that statistical significance, determined by a low p-value, indicates it's unlikely the observed sample effect occurred by chance if the null hypothesis is true. However, this doesn't necessarily imply the effect has practical importance. The script uses the example of a call center's average wait time to illustrate how a small difference can be statistically significant due to a large sample size but may not hold practical significance. It emphasizes the role of statisticians in identifying statistical significance and leaving the assessment of practical importance to subject matter experts, also highlighting the importance of reporting confidence intervals to understand the effect size.
Takeaways
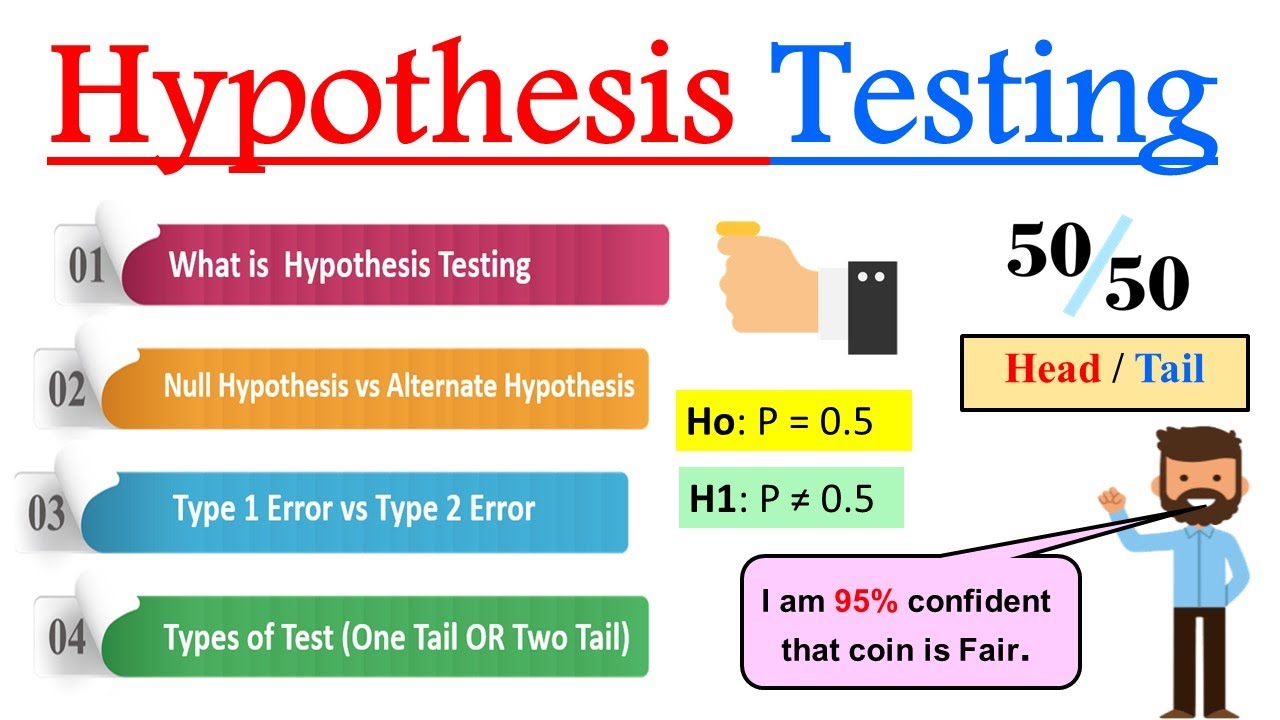
- 🔍 Hypothesis testing is used to determine statistical significance, which indicates the observed effect in a sample is unlikely due to chance alone.
- 📊 Statistical significance does not necessarily equate to practical significance; the latter is about the real-world impact of the observed effect.
- ⏱ An example given is a call center's average wait time, where a statistically significant difference of 0.6 seconds may or may not be practically significant.
- 📉 A small p-value, like 0.002, provides strong evidence against the null hypothesis, suggesting the population mean is different from the hypothesized value.
- 🔑 The practical importance of a statistically significant result is subjective and depends on the context and the stakeholders' perspective.
- 🔬 Statistical significance is highly dependent on the sample size; larger samples can find significance in even minor differences.
- 📈 Conversely, with smaller sample sizes, it might be challenging to detect statistically significant differences, even if they exist.
- 📊 The script illustrates how different sample sizes affect the outcome of hypothesis testing through box plots, showing insignificant p-values with small samples and significant ones with large samples.
- 📐 Even with the same effect size, a larger sample size can lead to a statistically significant result, emphasizing the role of sample size in hypothesis testing.
- 🤔 The practical significance of a statistically significant result is a separate question that should be considered by domain experts.
- 📊 Reporting a confidence interval alongside the hypothesis test results can provide additional context on the effect size and its potential practical importance.
Q & A
What is the difference between statistical significance and practical significance in hypothesis testing?
-Statistical significance refers to the likelihood that the observed effect in a sample is not due to chance, while practical significance is about whether the observed effect has real-world importance or impact.
Why might a small difference in sample mean result in a statistically significant p-value?
-A small difference can be statistically significant if the sample size is large enough, as even minor deviations from the hypothesized value can be detected with high precision.
What is a p-value in the context of hypothesis testing?
-A p-value is the probability of observing the sample results, or something more extreme, assuming the null hypothesis is true. A small p-value provides strong evidence against the null hypothesis.
How does sample size affect the outcome of a hypothesis test?
-A larger sample size increases the power of the test to detect even small differences as statistically significant, whereas a smaller sample size may not provide enough evidence to reject the null hypothesis even if a practical difference exists.
What is the role of a confidence interval in hypothesis testing?
-A confidence interval provides a range of values within which the true population parameter is likely to fall, and it helps to illustrate the size of the effect, which can be useful in determining practical significance.
Why is it important to consider both statistical and practical significance?
-While statistical significance tells us if the results are likely not due to chance, practical significance is crucial for understanding if the results have meaningful implications in a real-world context.
Can a hypothesis test result in a non-significant p-value with a large sample size?
-Yes, if the effect size is truly small and the variation within the sample is high, even a large sample size might not yield a statistically significant result.
What does it mean if the p-value is very small in a hypothesis test?
-A very small p-value indicates that it is highly unlikely that the observed results occurred by chance if the null hypothesis were true, suggesting strong evidence in favor of the alternative hypothesis.
How might a company interpret a statistically significant result with a small effect size?
-A company might view a statistically significant result with a small effect size as important if it aligns with their goals or operational thresholds, even if the practical impact is minimal.
In the given call center example, why might a 0.6-second difference be considered practically insignificant to some but significant to others?
-The perception of practical significance can vary based on individual or organizational goals. A 0.6-second difference might be negligible in one context but critical for meeting specific service level agreements in another.
What is the purpose of hypothesis testing in a research or business context?
-Hypothesis testing serves to make inferences about a population parameter based on sample data. It helps in decision-making by providing evidence to either accept or reject a claim or assumption about the population.
Outlines

このセクションは有料ユーザー限定です。 アクセスするには、アップグレードをお願いします。
今すぐアップグレードMindmap

このセクションは有料ユーザー限定です。 アクセスするには、アップグレードをお願いします。
今すぐアップグレードKeywords

このセクションは有料ユーザー限定です。 アクセスするには、アップグレードをお願いします。
今すぐアップグレードHighlights

このセクションは有料ユーザー限定です。 アクセスするには、アップグレードをお願いします。
今すぐアップグレードTranscripts

このセクションは有料ユーザー限定です。 アクセスするには、アップグレードをお願いします。
今すぐアップグレード関連動画をさらに表示
Lean 6 Sigma -- Module 2 Hypothesis Testing
UJI HIPOTESIS STATISTIK-Part 1
Uji Hipotesis: Lemma Neyman - Pearson (Kuasa Uji)
Masih berpikir bahwa hipotesis statistik itu membingungkan? | Statistika
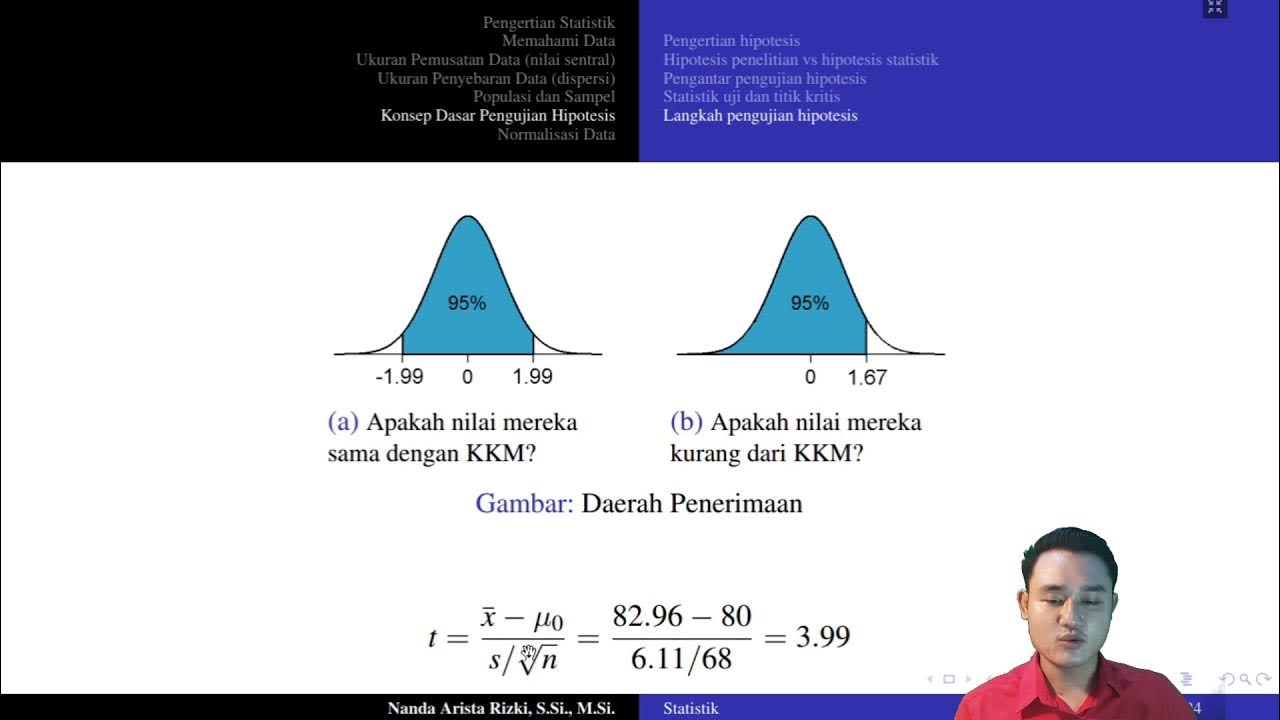
Konsep Dasar Pengujian Hipotesis
What is Hypothesis Testing in Statistics ? | Introduction to Hypothesis Testing
5.0 / 5 (0 votes)
