Statistics 101: Exploring measures of dispersion
Summary
TLDRThis video explains the concept of dispersion in data, focusing on how data is spread out or clustered together. Key measures of dispersion, including range, interquartile range, and standard deviation, are introduced to help understand how data values vary from the central tendency. The video provides examples such as package delivery times and exam scores to illustrate these concepts. It also highlights how dispersion impacts data analysis and decision-making, offering viewers the tools to evaluate the reliability and variability of data when drawing conclusions about a population.
Takeaways
- 😀 Data can be described by two key features: the location of the center (central tendency) and the size of the spread (dispersion).
- 😀 Central tendency represents the balance point of data, while dispersion refers to how spread out the data is.
- 😀 The concept of dispersion helps us understand how much uncertainty exists in a dataset, making it crucial for data analysis.
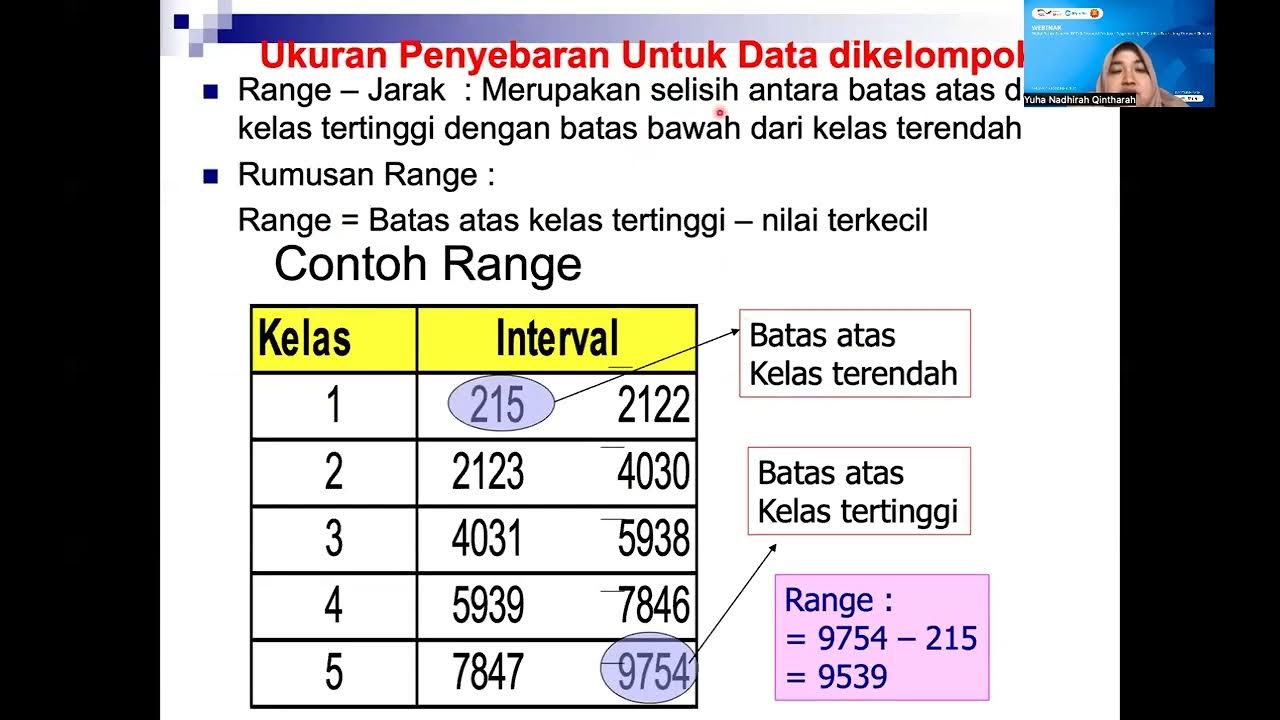
- 😀 The range is the difference between the largest and smallest values in a dataset, offering a quick measure of spread.
- 😀 The range is most useful when there are no extreme values (outliers) in the data. Outliers can make the range misleading.
- 😀 The interquartile range (IQR) measures dispersion by focusing on the middle 50% of data, providing more stability than the full range.
- 😀 The standard deviation tells us how spread out data points are from the mean and is the most commonly used measure of dispersion.
- 😀 A low standard deviation means data points are close to the mean, while a high standard deviation indicates greater variability within the data.
- 😀 In a normal distribution, data points are symmetrically distributed around the mean, creating a bell-shaped curve.
- 😀 The properties of the normal distribution are significant in understanding standard deviation: 68% of data points fall within ±1 SD, 95% within ±2 SD, and 99.7% within ±3 SD.
Q & A
What are the two main features used to describe a dataset?
-The two main features are the location of the centre or balance point, known as central tendency, and the size of the spread, known as dispersion.
What is dispersion in statistics?
-Dispersion refers to the extent to which a distribution is stretched or squeezed. It measures how spread out the data values are in a dataset.
Why are measures of dispersion important?
-They help assess how well measures of central tendency describe a dataset, allow us to understand variability, and support making informed decisions about data analysis and uncertainty.
What are the three common measures of dispersion discussed in the video?
-The three common measures of dispersion are the range, the interquartile range (IQR), and the standard deviation.
How is the range calculated and when is it most useful?
-The range is calculated as the highest value minus the lowest value. It is most useful when the dataset does not contain extreme values or outliers.
What is the interquartile range (IQR) and why is it considered more stable than the range?
-The interquartile range is the distance between the first quartile (Q1) and the third quartile (Q3), representing the middle 50% of the data. It is more stable because it ignores the top and bottom 25% of values, reducing the effect of outliers.
What does the standard deviation measure?
-The standard deviation measures how spread out data values are around the mean. A low standard deviation means values are close to the mean, while a high standard deviation indicates more variability.
What is an outlier, and how can it affect the range?
-An outlier is a value that is significantly different from the rest of the data. It can greatly increase the range, making it a misleading measure of dispersion.
What does a Normal distribution look like, and what are its properties?
-A Normal distribution has a symmetrical, bell-shaped curve with most values clustered around the centre. In this distribution, the mean, median, and mode are equal.
What proportion of data typically falls within one, two, and three standard deviations in a Normal distribution?
-Approximately 68% of data falls within ±1 standard deviation, 95% within ±2 standard deviations, and 99.7% within ±3 standard deviations from the mean.
How do measures of dispersion relate to the data analysis process?
-They form part of the 'explore, clean, and describe' stage of the data journey, helping analysts understand variability before deeper analysis and communication of insights.
What is the difference between positively and negatively skewed data?
-Positively skewed data have a long tail on the right side with most values on the low end, while negatively skewed data have a long tail on the left with most values on the high end.
Outlines

このセクションは有料ユーザー限定です。 アクセスするには、アップグレードをお願いします。
今すぐアップグレードMindmap

このセクションは有料ユーザー限定です。 アクセスするには、アップグレードをお願いします。
今すぐアップグレードKeywords

このセクションは有料ユーザー限定です。 アクセスするには、アップグレードをお願いします。
今すぐアップグレードHighlights

このセクションは有料ユーザー限定です。 アクセスするには、アップグレードをお願いします。
今すぐアップグレードTranscripts

このセクションは有料ユーザー限定です。 アクセスするには、アップグレードをお願いします。
今すぐアップグレード関連動画をさらに表示

Range, variance and standard deviation as measures of dispersion | Khan Academy

Dispersi Relatif [STATISTIK 1]

Statistika 2 ~ Ukuran Penyebaran Data (Jangkauan, Kuartil, Hamparan) ~ Materi PJJ Kelas VIII / 8 SMP
KULIAH STATISTIK (6) - UKURAN VARIABILITAS DATA
Varians dan Simpangan Baku

Ilmu Data #5 - Varians dan Standar Deviasi
5.0 / 5 (0 votes)
