KUPAS TUNTAS: Apakah Perbedaan Statistik Inferensial dengan Statistik Deskriptif ?
Summary
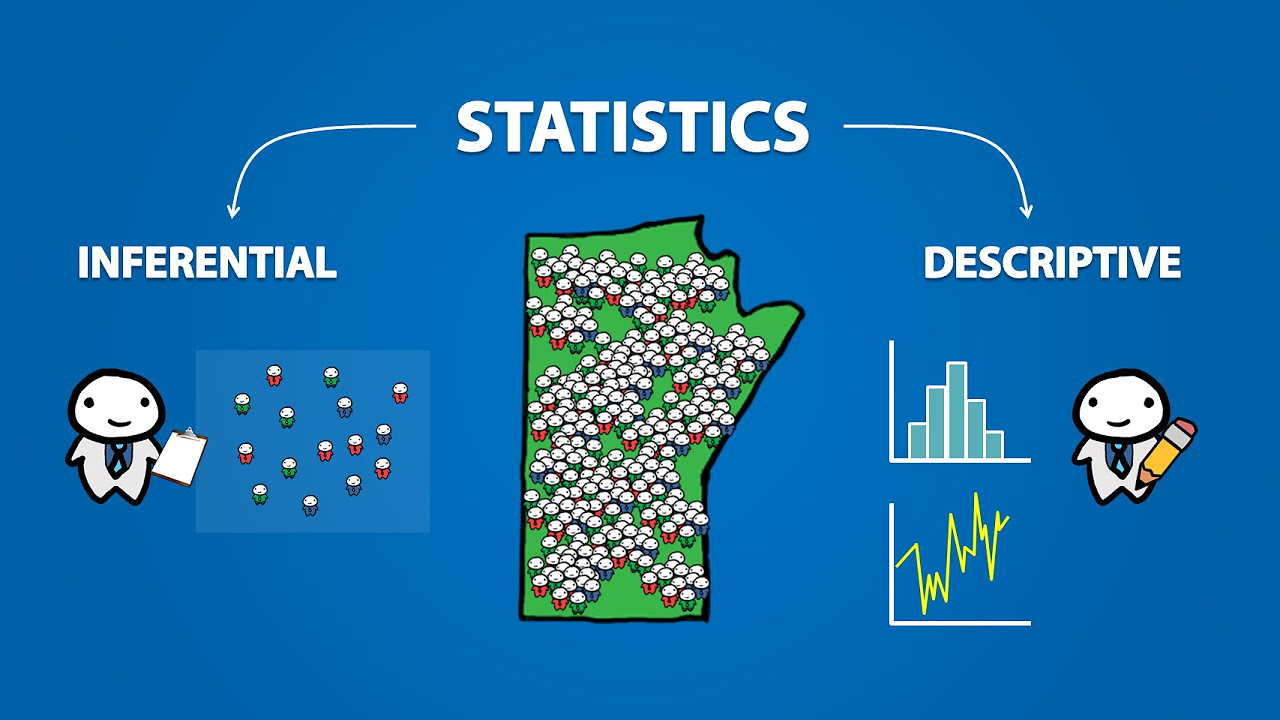
TLDRThis video explains the key differences between inferential and descriptive statistics. Descriptive statistics focuses on summarizing and visualizing data, such as trends or averages, without making generalizations about larger populations. Inferential statistics, on the other hand, uses sample data to make predictions and draw conclusions about a broader population, often utilizing probability theory. The video also explores the concepts of population and sample, highlighting the importance of representativeness in inferential statistics. Ultimately, the content provides a clear distinction between the two statistical methods and their applications.
Takeaways
- 😀 Statistics is both a science and an art, focusing on the collection, processing, analysis, interpretation, and conclusion of data.
- 😀 Inferential statistics is used when the goal is to generalize conclusions from a sample to a larger population.
- 😀 Descriptive statistics is used to summarize and describe data, without generalizing to a larger population.
- 😀 Inferential statistics employs probability theory to estimate characteristics of a population from a sample.
- 😀 Descriptive statistics uses tools like bar charts, histograms, and pie charts to visualize trends and data properties.
- 😀 Inferential statistics is essential for testing hypotheses and determining the effectiveness of treatments or policies on larger groups.
- 😀 Descriptive statistics is concerned with measuring data spread, such as variability and standard deviation, without making broader conclusions.
- 😀 The population refers to a broad group of individuals or items, while a sample is a smaller, manageable subset of that population.
- 😀 Inferential statistics helps in estimating parameters (such as population averages or variances) based on sample statistics.
- 😀 The main requirement for a sample is representativeness, meaning it should accurately reflect the characteristics of the larger population for generalization.
- 😀 Descriptive statistics doesn't involve sample or population distinctions; it simply describes and summarizes the data at hand.
Q & A
What is the definition of statistics as presented in the script?
-Statistics is described as the science (or art) of collecting, processing, analyzing, interpreting, and concluding from data gathered through observations, surveys, or other means.
What is the main difference between inferential and descriptive statistics?
-Inferential statistics aims to generalize findings from a sample to a broader population, often using probability theory, whereas descriptive statistics focuses on summarizing and describing data without generalizing it.
What role does inferential statistics play in generalizing data?
-Inferential statistics allows us to make conclusions about a larger population based on sample data, such as estimating trends, effects, or policies for a broader group.
What are the key characteristics of descriptive statistics?
-Descriptive statistics is limited to summarizing and describing the data in hand, using methods like averages, frequencies, and visual charts such as bar graphs or histograms. It does not aim to generalize or predict beyond the sample data.
Why is representativeness important when using a sample in inferential statistics?
-Representativeness ensures that the sample accurately reflects the population, so the conclusions drawn from the sample can be generalized to the broader population with confidence.
What is the relationship between population and sample in inferential statistics?
-In inferential statistics, a sample is a subset of the population. While we cannot research an entire population due to its size, a sample is taken and analyzed to make inferences about the entire population.
What are 'parameters' and 'statistics' in the context of inferential statistics?
-Parameters refer to the characteristics or measurements of the entire population, while statistics refers to the corresponding measurements from the sample, which are used to estimate population parameters.
How does inferential statistics estimate the population average from a sample?
-Inferential statistics uses the sample average (X-bar) to estimate the population average, which is usually unknown unless a census is conducted. This estimation helps in making broader generalizations about the population.
Can descriptive statistics provide conclusions about a population?
-No, descriptive statistics only describes the data at hand. It provides insights into trends, averages, and distributions but does not make conclusions or generalizations about a larger population.
What is the purpose of a pie chart in descriptive statistics as explained in the script?
-A pie chart in descriptive statistics is used to show proportions or trends within the sample data. For example, it can illustrate market share for different car brands without drawing conclusions about the entire population or future trends.
Outlines

このセクションは有料ユーザー限定です。 アクセスするには、アップグレードをお願いします。
今すぐアップグレードMindmap

このセクションは有料ユーザー限定です。 アクセスするには、アップグレードをお願いします。
今すぐアップグレードKeywords

このセクションは有料ユーザー限定です。 アクセスするには、アップグレードをお願いします。
今すぐアップグレードHighlights

このセクションは有料ユーザー限定です。 アクセスするには、アップグレードをお願いします。
今すぐアップグレードTranscripts

このセクションは有料ユーザー限定です。 アクセスするには、アップグレードをお願いします。
今すぐアップグレード関連動画をさらに表示


5.0 / 5 (0 votes)
