Analisis Chi Square dengan aplikasi SPSS
Summary
TLDRThis video explains the use of the Chi-Square test (C Square test) to assess the relationship between variables such as gender, age, and hypertension. The tutorial covers the process of preparing and analyzing data in SPSS, including entering the correct codes for categorical data. It highlights key decision-making points, such as the significance level (p-value), ensuring that expected counts meet necessary criteria, and how to interpret results. The video also addresses how to handle different table sizes (2x2 vs. 2x3) and explains the impact of categorical data on Chi-Square test results in the context of hypertension analysis.
Takeaways
- 😀 The Chi-Square (C Square) test is used to determine the relationship between categorical variables, such as gender, age, and hypertension.
- 😀 The Chi-Square test analyzes the relationship between rows (independent variables) and columns (dependent variables) in categorical data tables.
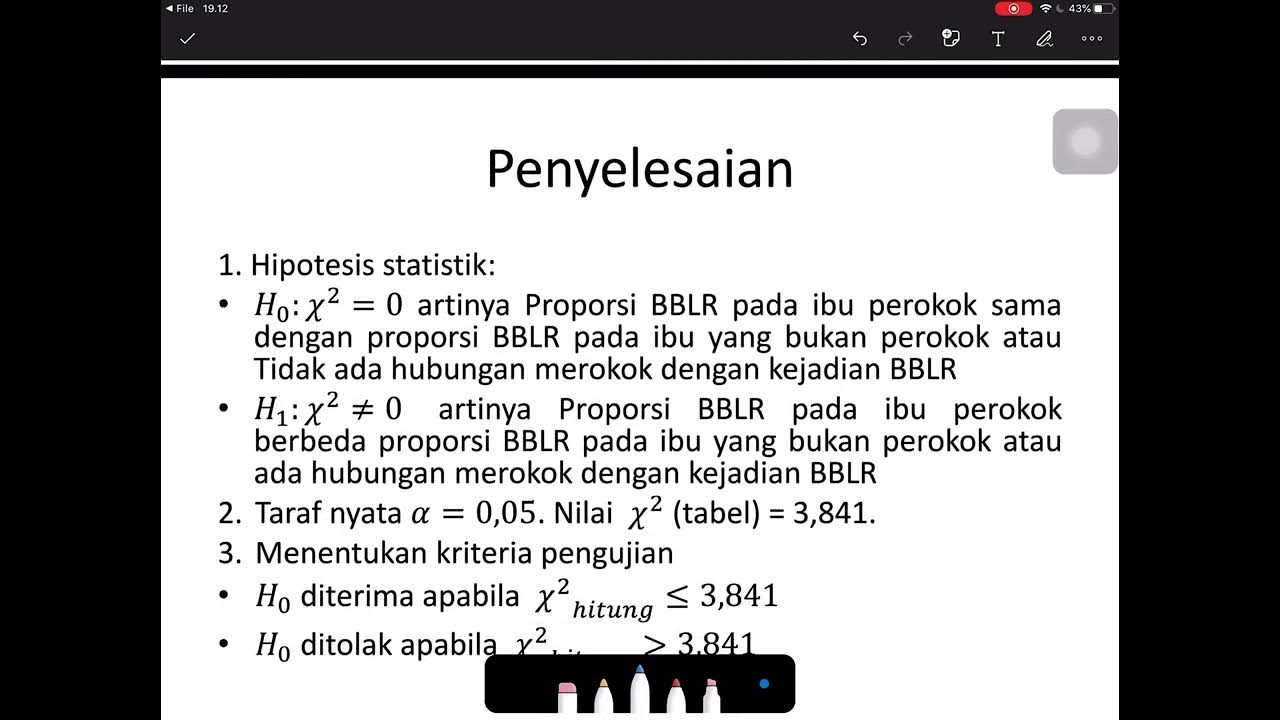
- 😀 If the significance value (p-value) is less than 0.05, it indicates a significant relationship between the variables being tested; if greater than 0.05, there is no significant relationship.
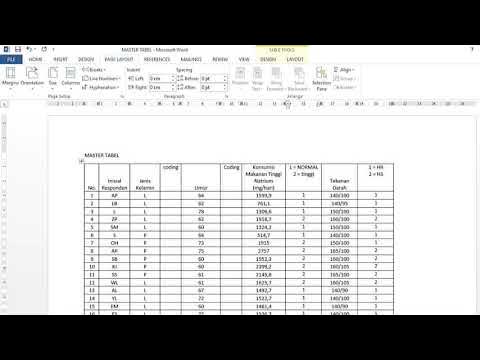
- 😀 The test uses categorical or frequency data and can be performed in SPSS using the Cross Tab function.
- 😀 It is important to ensure that the expected count in the cells of the table is not less than 5 when the table is 2x2 for valid results.
- 😀 The data entered into SPSS must be accurate and properly coded to ensure correct results in the Chi-Square test.
- 😀 The case processing summary in SPSS helps identify if there are any missing or invalid data points.
- 😀 In the example given, the Chi-Square test for gender and hypertension yielded no significant relationship (p-value > 0.05).
- 😀 When testing with a 2x3 table or larger, it is allowed for some expected values to be less than 5, but they must not exceed 20% of the cells in the table.
- 😀 The Chi-Square test value can be assessed using the 'Exact Test' or 'Continuity Correction,' and the significance must be evaluated to make a decision.
- 😀 The outcome of the Chi-Square test suggests no relationship between gender or age and hypertension in the given dataset, as all p-values are greater than 0.05.
Q & A
What is the C Square test and why is it used?
-The C Square test is used to determine the relationship between two categorical variables. It helps to assess whether the frequencies observed in different categories are significantly different from the expected frequencies.
How is the significance of a C Square test determined?
-The significance of a C Square test is determined by the p-value. If the p-value (significance value) is less than 0.05, it indicates a significant relationship between the variables. If it is greater than 0.05, there is no significant relationship.
What types of data are required for a C Square test?
-The C Square test requires categorical data or frequency data, where the variables are organized into rows and columns, and the data represents counts or frequencies of occurrences.
What is the purpose of the 'Case Processing Summary' in SPSS?
-The 'Case Processing Summary' in SPSS is used to verify the validity of the entered data. It checks if all the data is correctly entered and if there are any missing values or discrepancies in the dataset.
How can you interpret the results of the C Square test in SPSS?
-To interpret the C Square test results in SPSS, you need to check the significance value. If it is greater than 0.05, it means no significant relationship exists between the variables. If it is less than 0.05, there is a significant relationship.
What does it mean if the expected count value in a 2x2 table is less than 5?
-If the expected count value in a 2x2 table is less than 5, the C Square test cannot be continued, as this violates the assumption of the test. For tables 2x2, all expected counts must be at least 5 for the results to be valid.
What is the difference between a 2x2 and 2x3 table in the context of the C Square test?
-In a 2x2 table, there are two categories for each variable, resulting in four cells. In a 2x3 table, one variable has two categories, while the other has three, resulting in six cells. The C Square test can handle more than two categories in one of the variables.
How do you handle missing data in a C Square test using SPSS?
-In SPSS, missing data is handled by checking the 'Case Processing Summary'. If any respondents are missing from a variable, it will be noted. You can either exclude these cases or find ways to handle the missing data before performing the test.
What happens if the p-value from the C Square test is greater than 0.05?
-If the p-value is greater than 0.05, it indicates that there is no significant relationship between the variables being tested. The null hypothesis, which assumes no relationship, is not rejected.
What is the maximum allowable percentage of cells with expected counts less than 5 in a 2x3 table?
-In a 2x3 or larger table, the expected count for a maximum of 20% of the cells can be less than 5. If more than 20% of the cells have expected counts below 5, the test is invalid.
Outlines

このセクションは有料ユーザー限定です。 アクセスするには、アップグレードをお願いします。
今すぐアップグレードMindmap

このセクションは有料ユーザー限定です。 アクセスするには、アップグレードをお願いします。
今すぐアップグレードKeywords

このセクションは有料ユーザー限定です。 アクセスするには、アップグレードをお願いします。
今すぐアップグレードHighlights

このセクションは有料ユーザー限定です。 アクセスするには、アップグレードをお願いします。
今すぐアップグレードTranscripts

このセクションは有料ユーザー限定です。 アクセスするには、アップグレードをお願いします。
今すぐアップグレード関連動画をさらに表示
Uji Chi Square (Contoh soal dan penyelesaian)
Uji Statistik Chi Square dengan tabel 2X2. cara membaca hasil uji chi square.

Video Tutorial Cara Uji Chi Square/Chi Kuadrat dengan Program SPSS

How to calculate a Chi-Square Test?

video 14.2. chi-square test of independence
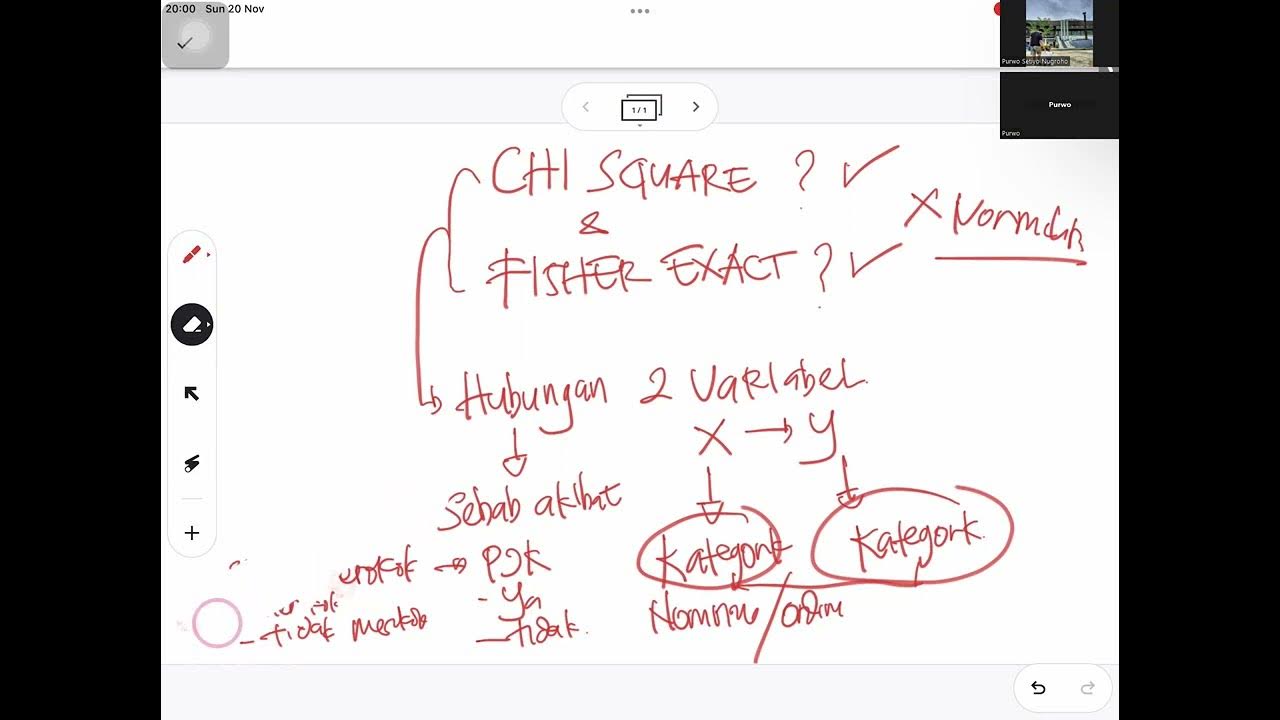
SYARAT MENGGUNAKAN UJI CHI SQUARE DAN FISHER EXACT
5.0 / 5 (0 votes)
