Reliability Analysis using minitab 18
Summary
TLDRIn this tutorial, Jorge Salas explains how to conduct reliability analysis using Minitab 18 with truck failure data. He demonstrates how to use the software to identify the best-fitting distribution, interpret various charts like the probability and survival plots, and estimate parameters such as shape and scale. The tutorial also covers advanced features like warranty analysis, cumulative failure probability, and using visual tools for better understanding of data. The video provides step-by-step guidance on performing reliability analysis, making it easier to visualize and interpret complex data for informed decision-making.
Takeaways
- 😀 The speaker introduces themselves as Jorge Will Salas and mentions their experience in reliability analysis and using Minitab 18 for such analyses.
- 😀 The dataset being analyzed is from truck failures, specifically miles to failure, with both failure and censored data being used in the analysis.
- 😀 Censored data refers to units that have not failed by the time the data was taken, indicated by a 'Z'.
- 😀 To determine the best distribution fit for the data, Minitab's 'Reliability Distribution Analysis' tool is used, selecting 'Right Censoring' when data includes failures and censored units.
- 😀 The speaker emphasizes using the Least Squares method over Maximum Likelihood when sample sizes are small, as in this case with 28 samples.
- 😀 The Weibull distribution is identified as the best fit for the data based on Minitab’s probability plots and correlation coefficients.
- 😀 The speaker demonstrates how to use Minitab’s 'Distribution Overview Plot' for better visualization of failure distributions, including probability density and survival functions.
- 😀 The analysis includes reference lines for understanding failure milestones, such as predicting when 50% of trucks will fail, which occurs around 45,000 miles.
- 😀 Further analysis involves estimating failure probabilities for specific mileage points, such as understanding the likelihood of failure before 10,000 miles.
- 😀 Minitab provides tools for visual representation of the failure data, like cumulative failure plots, which allow for understanding the cumulative percentage of failures at any given mile range.
- 😀 The speaker shows how Minitab's probability distribution plot can help visually assess warranty-related questions, like predicting failure percentages before a specific mileage threshold (e.g., 30,000 miles).
Q & A
What is the primary goal of the reliability analysis presented in the video?
-The primary goal is to perform a reliability analysis of truck failure data using Minitab 18, by fitting a distribution model, identifying parameters, and visualizing the results to understand failure patterns and survival probabilities.
What type of data is used in the reliability analysis example?
-The data used comes from truck failures, specifically the miles to failure, where failures are indicated by 'F' and censored data (running trucks) is indicated by 'C'.
What does censored data mean in the context of reliability analysis?
-Censored data refers to units that have not yet failed by the time data is collected. For example, a truck that is still running at 18,489 miles is considered censored.
Which Minitab method is recommended when working with small sample sizes, and why?
-The Least Squares method is recommended for small sample sizes (like 28 data points) because it is more reliable compared to Maximum Likelihood estimation, which is better suited for larger datasets.
How does Minitab determine the best distribution for the failure data?
-Minitab uses probability plots and correlation coefficients to test different distributions. The best fit is determined based on the distribution with the highest Pearson correlation coefficient, indicating the closest match to the data.
Why is the Weibull distribution often chosen for reliability analysis?
-The Weibull distribution is commonly chosen for reliability analysis because it is flexible and can model various types of failure patterns. It is often the best fit for failure data in reliability studies.
What is the significance of the 'survival plot' in reliability analysis?
-The survival plot shows the proportion of units still functioning at various miles, helping to visualize the likelihood of survival over time. It provides a clear view of the expected life span of the trucks in this case.
How can Minitab's 'distribution overview plot' be used in this analysis?
-The distribution overview plot in Minitab helps to visualize the overall distribution of failures, highlighting the probability density function, survival plot, and failure distribution, giving a comprehensive view of the failure patterns.
What additional analysis can be done with Minitab's parametric distribution analysis feature?
-With Minitab's parametric distribution analysis, you can estimate specific percentiles (e.g., the 50% failure point) and probabilities for failure at certain mileages, providing deeper insights into failure trends.
How does Minitab help visualize warranty analysis for reliability data?
-Minitab helps visualize warranty analysis by creating probability distribution plots that show the percentage of failures expected before a given warranty mileage. This allows companies to assess the potential costs of warranties based on failure probabilities.
Outlines

このセクションは有料ユーザー限定です。 アクセスするには、アップグレードをお願いします。
今すぐアップグレードMindmap

このセクションは有料ユーザー限定です。 アクセスするには、アップグレードをお願いします。
今すぐアップグレードKeywords

このセクションは有料ユーザー限定です。 アクセスするには、アップグレードをお願いします。
今すぐアップグレードHighlights

このセクションは有料ユーザー限定です。 アクセスするには、アップグレードをお願いします。
今すぐアップグレードTranscripts

このセクションは有料ユーザー限定です。 アクセスするには、アップグレードをお願いします。
今すぐアップグレード関連動画をさらに表示

Basic DOE Analysis Example in Minitab

Tutorial Uji Asumsi Klasik dengan SPSS serta Interpretasi Output
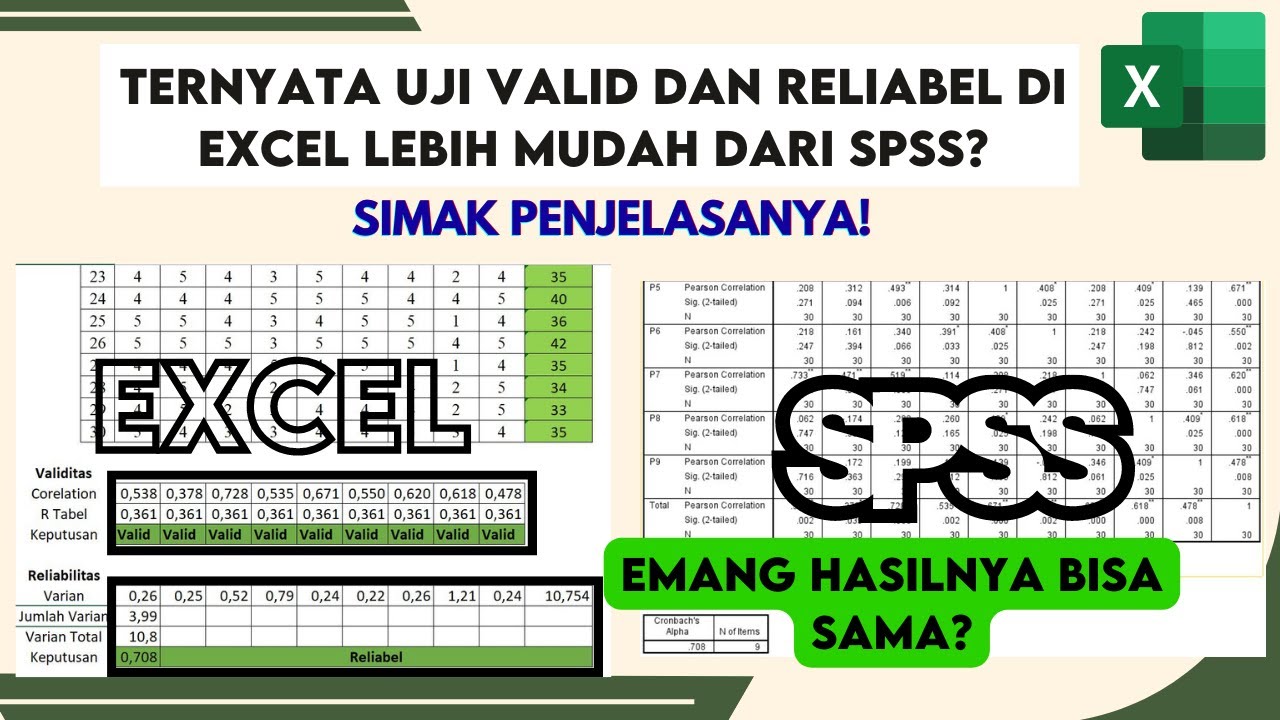
🔴 Lebih Mudah! Cara Uji Validitas dan Reliabilitas Dengan Excel | Uji Validitas dan Reliabilitas
BELAJAR UJI VALIDITAS DAN RELIABILITAS DATA PRIMER DENGAN SPSS (Bagian 1)

Dongeng tentang uji validitas Cara uji validitas spss 23, cara baca output

CARA MENGUJI VALIDITAS DAN RELIABILITAS SEBUAH DATA
5.0 / 5 (0 votes)
