cara cepat sistem pertidaksamaan linier dua variabel dari grafik
Summary
TLDRThis tutorial explains the process of graphing and solving linear inequalities in two variables. It covers how to derive the equation of a line from its intercepts on the x and y axes, and how to determine the shaded region based on whether the inequality is greater than or less than. The speaker provides multiple examples, demonstrating the formulation of line equations and how the graph's direction (greater or less than) affects the solution region. By following the tutorial, users will gain a clearer understanding of graphing linear inequalities and applying them in practice.
Takeaways
- 😀 Learn how to derive the equation of a straight line from the x and y intercepts in a coordinate system.
- 😀 When the line intersects the y-axis, the corresponding y-intercept is used to find the equation.
- 😀 If the line intersects the x-axis, the x-intercept is used to derive the equation.
- 😀 The formula `Ax + By = A * B` is key in finding linear equations from intercepts.
- 😀 Graphing inequalities involves identifying which side of the line satisfies the inequality (above or below).
- 😀 A positive coefficient for x indicates that the inequality region is above the line, while a negative coefficient means below.
- 😀 For example, `4x + 2y >= 8` means shading above the line, whereas `4x + 2y < 8` means shading below the line.
- 😀 The process of multiplying constants and coordinates during derivation is important for forming correct equations.
- 😀 To handle negative values in equations, pay attention to the direction of the inequality (greater than or less than).
- 😀 Practicing with specific examples, like `3x - 5y <= -15`, helps in visualizing how inequalities relate to their graphical representation.
Q & A
What is the first step when working with a system of linear inequalities in two variables?
-The first step is to create the equation of a straight line, which will be used as the base for determining the inequality.
How do you form the equation of a line when given the x and y intercepts?
-To form the equation, you multiply the x-intercept by the y-coordinate and the y-intercept by the x-coordinate. The equation of the line is then derived from these values.
What does it mean when a line does not intersect the y-axis?
-If the line does not intersect the y-axis, it means that the x-intercept is the only relevant point for forming the equation, and the equation is derived based on that intercept.
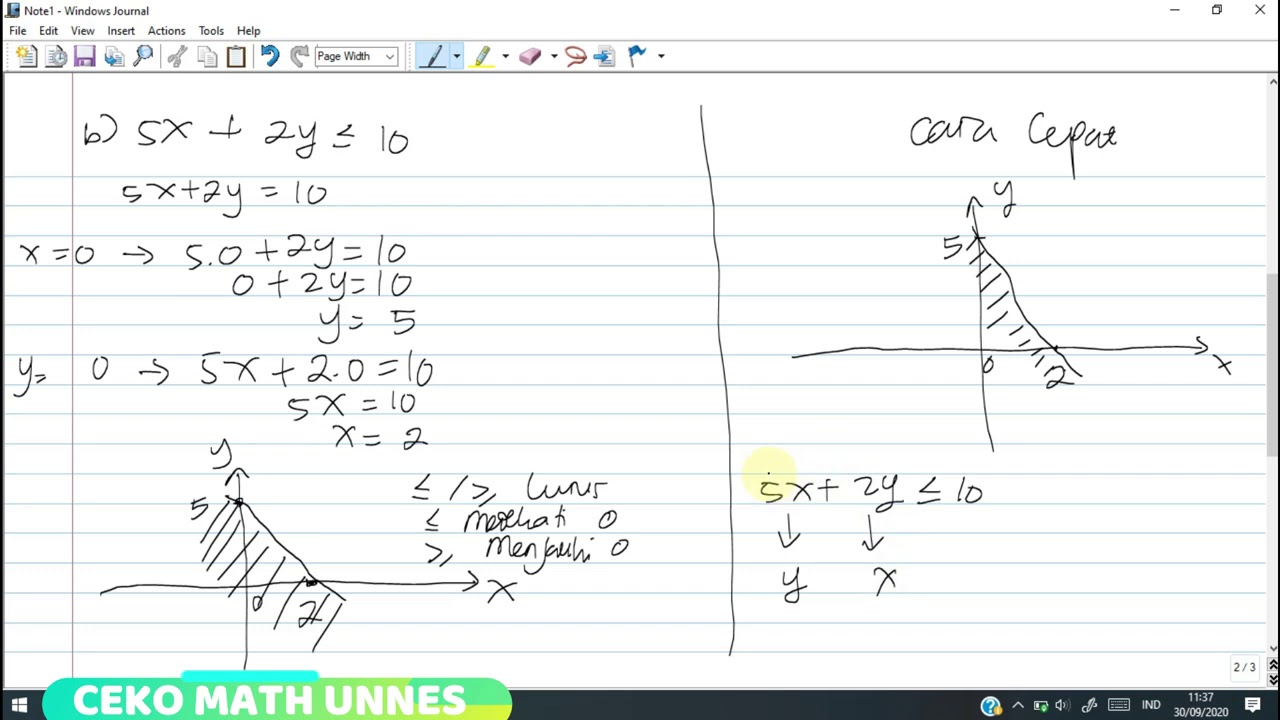
In the example with the equation 4x + 2y ≥ 8, which direction does the shading of the graph indicate?
-The shading will be to the right, indicating that the values for x and y in the region are greater than or equal to the equation's right-hand side.
What does the shading direction tell you about the inequality?
-The shading direction indicates whether the inequality is greater than or equal to (shaded to the right) or less than or equal to (shaded to the left).
How do you determine whether to use 'greater than' or 'less than' when graphing a linear inequality?
-If the coefficient of x is positive, the shading will be to the right (greater than), and if it’s negative, the shading will be to the left (less than).
What happens when you have a negative coefficient in the equation, such as -3x + 4y ≤ 12?
-The shading will be to the left, indicating that the values for x and y in this region satisfy the inequality 'less than or equal to.'
What is the significance of a dashed or solid line when graphing inequalities?
-A solid line means the inequality is 'greater than or equal to' or 'less than or equal to,' while a dashed line indicates a strict inequality (i.e., 'greater than' or 'less than').
How do you determine the correct inequality symbol when given the intercept form of an equation?
-The inequality symbol is determined by the direction of the shading on the graph. If the shading is to the right, the inequality will be 'greater than or equal to.' If the shading is to the left, the inequality will be 'less than or equal to.'
In the example with the equation 6x + 6y ≥ 36, what should you do to simplify the equation?
-To simplify, divide the entire inequality by 6, resulting in the simpler equation x + y ≥ 6.
Outlines

このセクションは有料ユーザー限定です。 アクセスするには、アップグレードをお願いします。
今すぐアップグレードMindmap

このセクションは有料ユーザー限定です。 アクセスするには、アップグレードをお願いします。
今すぐアップグレードKeywords

このセクションは有料ユーザー限定です。 アクセスするには、アップグレードをお願いします。
今すぐアップグレードHighlights

このセクションは有料ユーザー限定です。 アクセスするには、アップグレードをお願いします。
今すぐアップグレードTranscripts

このセクションは有料ユーザー限定です。 アクセスするには、アップグレードをお願いします。
今すぐアップグレード関連動画をさらに表示
SPtDV Matematika Kelas 10 • Part 1: Pertidaksamaan Linear & Kuadrat Dua Variabel
Pertidaksamaan linear dua variabel kelas X. SOAL DAN PEMBAHASAN TRIK CEPAT. Part #1

Sistem Pertidaksamaan Linear Dua Variabel
Sistem Pertidaksamaan Linear Dua Variabel | Pengetahuan Kuantitatif | Alternatifa
MENENTUKAN MODEL MATEMATIKA DARI SOAL CERITA SPtLDV
Menyelesaikan Permasalahan Program Linear Menentukan Nilai Optimum dengan Metode Uji Titik Pojok
5.0 / 5 (0 votes)
