TUTORIAL MENGGUNAKAN VOSViewer UNTUK PEMETAAN, VISUALISASI DAN EKSPLORASI PADA PENELITIAN
Summary
TLDRIn this tutorial, the presenter introduces VOSviewer, a software tool for visualizing research data. The focus is on using VOSviewer to display research novelty and avoid overlap with previous studies. The tutorial guides viewers on how to gather data from Google Scholar, convert it to RIS format, and import it into VOSviewer for analysis. It demonstrates how to visualize and analyze relationships in research topics, with examples related to Islamic education. The tutorial highlights how VOSviewer helps identify unique research contributions and visualize complex data effectively.
Takeaways
- 😀 VOSviewer is a tool for visualizing research data to make it more engaging and highlight the novelty in your research.
- 😀 VOSviewer helps identify the uniqueness of your research compared to existing studies, like exploring a new version of fried rice, avoiding overlap with previous research.
- 😀 Before using VOSviewer, gather research data through Google Scholar, where you can export citation data in RIS format for easy use in VOSviewer.
- 😀 If you've already downloaded PDFs but need RIS format, you can use Mendeley to convert the data by exporting it as RIS.
- 😀 VOSviewer allows you to import RIS files and generate a map based on citation data like titles and abstracts.
- 😀 The software provides options like 'binary counting' or 'full counting' for data analysis and offers automatic suggestions for the minimum number of occurrences.
- 😀 Once data is selected in VOSviewer, you can refine it by removing irrelevant terms or categories to focus on your research topic, e.g., Islamic education.
- 😀 VOSviewer visualizes connections between terms, helping you identify key topics and trends in your field of study.
- 😀 The visualization allows you to discover potential gaps in the research, such as exploring Islamic education in a new context like neuro-based learning.
- 😀 Once your data is visualized, you can take screenshots and export images to present the novelty of your research in reports or presentations.
Q & A
What is the main purpose of using VOSviewer in research?
-VOSviewer is used to display research data in a more engaging and visually appealing way. It helps researchers identify novel aspects or originality in their work by highlighting how their research differs from previous studies.
How does VOSviewer help researchers avoid duplication in their work?
-VOSviewer helps researchers identify the novelty of their research by comparing it to previous studies, ensuring that their work does not overlap with existing research. For example, researchers can create unique versions of a concept, such as 'fried rice,' that distinguish their work from previous versions.
What is the first step to using VOSviewer for research analysis?
-The first step is to open Google Scholar and search for relevant articles. Instead of downloading PDFs directly, researchers can click on the citation icon to save the article in a format that VOSviewer can read, such as RIS.
How can researchers convert their downloaded PDFs into a compatible format for VOSviewer?
-If researchers have already downloaded PDFs, they can use Mendeley to convert the files into RIS format. By dragging the PDFs into Mendeley, they can export them as RIS files, which can then be used in VOSviewer for analysis.
What is the 'Create a Map' function in VOSviewer used for?
-The 'Create a Map' function in VOSviewer is used to generate a visual representation of the research data. Researchers can select specific files, such as RIS files, to map out key relationships between concepts and terms found in their research.
What options are available when selecting data for analysis in VOSviewer?
-In VOSviewer, users can choose between different types of data, such as 'title and abstract' or 'full-text.' The analysis can be customized to focus on specific elements that are most relevant to the research goals.
What does the 'Binary Counting' option in VOSviewer refer to?
-The 'Binary Counting' option in VOSviewer refers to a method of counting where only the presence or absence of a term or concept is considered, rather than its frequency. This helps to simplify the analysis and identify key relationships between terms.
How does VOSviewer suggest minimum numbers for terms during analysis?
-VOSviewer recommends a minimum number of occurrences for terms to be included in the analysis. Users can adjust this number based on their research needs, either lowering or increasing it to refine the data set.
What happens when irrelevant terms are found during the analysis in VOSviewer?
-When irrelevant terms are detected during the analysis, users can manually remove them to ensure that only relevant data is considered in the final visualization. This step helps focus on the most pertinent information for the research.
How can researchers visualize and share their findings using VOSviewer?
-Researchers can capture a screenshot of the VOSviewer map to share their findings visually. They can save the map in various formats such as PNG or JPG, and then use it in presentations or reports, making it easier to communicate the results of their research.
Outlines

このセクションは有料ユーザー限定です。 アクセスするには、アップグレードをお願いします。
今すぐアップグレードMindmap

このセクションは有料ユーザー限定です。 アクセスするには、アップグレードをお願いします。
今すぐアップグレードKeywords

このセクションは有料ユーザー限定です。 アクセスするには、アップグレードをお願いします。
今すぐアップグレードHighlights

このセクションは有料ユーザー限定です。 アクセスするには、アップグレードをお願いします。
今すぐアップグレードTranscripts

このセクションは有料ユーザー限定です。 アクセスするには、アップグレードをお願いします。
今すぐアップグレード関連動画をさらに表示

VIDEO PERTEMUAN 01 MENENTUKAN TOPIK PENELITIAN
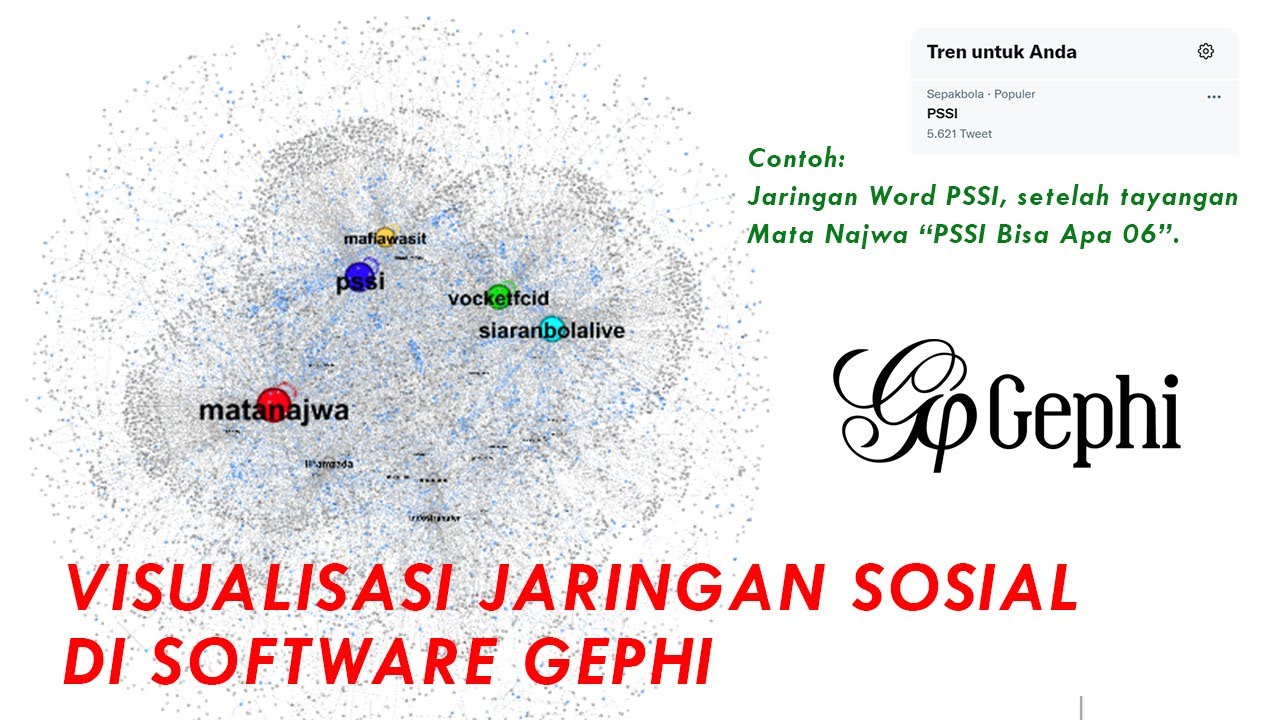
Visualisasi Jaringan Sosial dengan Menggunakan Software GEPHI.

Install Wireshark dan Cara menggunakan wireshark pertama kali

Pengenalan SPSS bagi Pemula - Pertemuan 5

Introdução ao Epi Info (Aula 01): Visão Geral

How to Copy & Paste on Codetantra | Copy Paste Trick | Use Autotyper in codetantra | 100% Working
5.0 / 5 (0 votes)
