Contoh soal nilai optimum dan pembahasannya
Summary
TLDRThis video explains the process of finding the maximum value of an objective function (2x + 3y) subject to a system of inequalities. The speaker outlines the steps, including graphing the inequalities, identifying the feasible region, and using substitution and elimination methods to find the points of intersection. The objective function is then evaluated at these points to determine the maximum value. The solution involves finding the largest value from the calculated points, demonstrating the application of linear programming techniques in optimization problems.
Takeaways
- 😀 The objective function to maximize is: 2x + 3y.
- 😀 The system of constraints consists of: 3x + 2y ≥ 12, x + y ≤ 5, and x, y ≥ 0.
- 😀 To solve the problem, first graph the corresponding equations of the constraints.
- 😀 The line 3x + 2y = 12 has intercepts at (0, 6) and (4, 0).
- 😀 The line x + y = 5 has intercepts at (0, 5) and (5, 0).
- 😀 The feasible region is found by selecting the area above the red line and below the blue line.
- 😀 To solve for the intersection points, use the elimination or substitution method.
- 😀 The intersection points are (0, 5), (2, 3), and (4, 0).
- 😀 Substituting these points into the objective function gives values of 15, 12, and 8, respectively.
- 😀 The maximum value of the objective function is 15, occurring at the point (0, 5).
Q & A
What is the objective function in the problem discussed in the transcript?
-The objective function is 2x + 3y.
What system of inequalities needs to be satisfied in this problem?
-The system of inequalities is: 3x + 2y ≥ 12, x + y ≤ 5, and x, y ≥ 0.
How is the solution to the system of inequalities represented in the transcript?
-The solution is represented graphically, with the feasible region determined by the inequalities.
What is the approach used to solve the inequalities graphically?
-The approach involves plotting the lines corresponding to the equations 3x + 2y = 12 and x + y = 5 on a graph, and identifying the feasible region based on the inequalities.
How do we determine the location of the feasible region based on the inequalities?
-For 3x + 2y ≥ 12, the feasible region is above the red line, while for x + y ≤ 5, it is below the blue line.
What does the notation '≥' and '≤' signify in terms of graphing?
-'≥' means the region above the line, while '≤' means the region below the line.
How are the intersection points of the lines determined?
-The intersection points are found by solving the system of equations formed by the lines.
What is the process of solving the system of equations in the transcript?
-The system of equations is solved by elimination, resulting in the values of x and y that satisfy both equations.
What is the intersection point of the lines based on the elimination method?
-The intersection point is (2, 3).
How do we determine the maximum value of the objective function?
-To find the maximum value, we substitute the intersection points into the objective function and select the highest value.
Outlines

このセクションは有料ユーザー限定です。 アクセスするには、アップグレードをお願いします。
今すぐアップグレードMindmap

このセクションは有料ユーザー限定です。 アクセスするには、アップグレードをお願いします。
今すぐアップグレードKeywords

このセクションは有料ユーザー限定です。 アクセスするには、アップグレードをお願いします。
今すぐアップグレードHighlights

このセクションは有料ユーザー限定です。 アクセスするには、アップグレードをお願いします。
今すぐアップグレードTranscripts

このセクションは有料ユーザー限定です。 アクセスするには、アップグレードをお願いします。
今すぐアップグレード関連動画をさらに表示
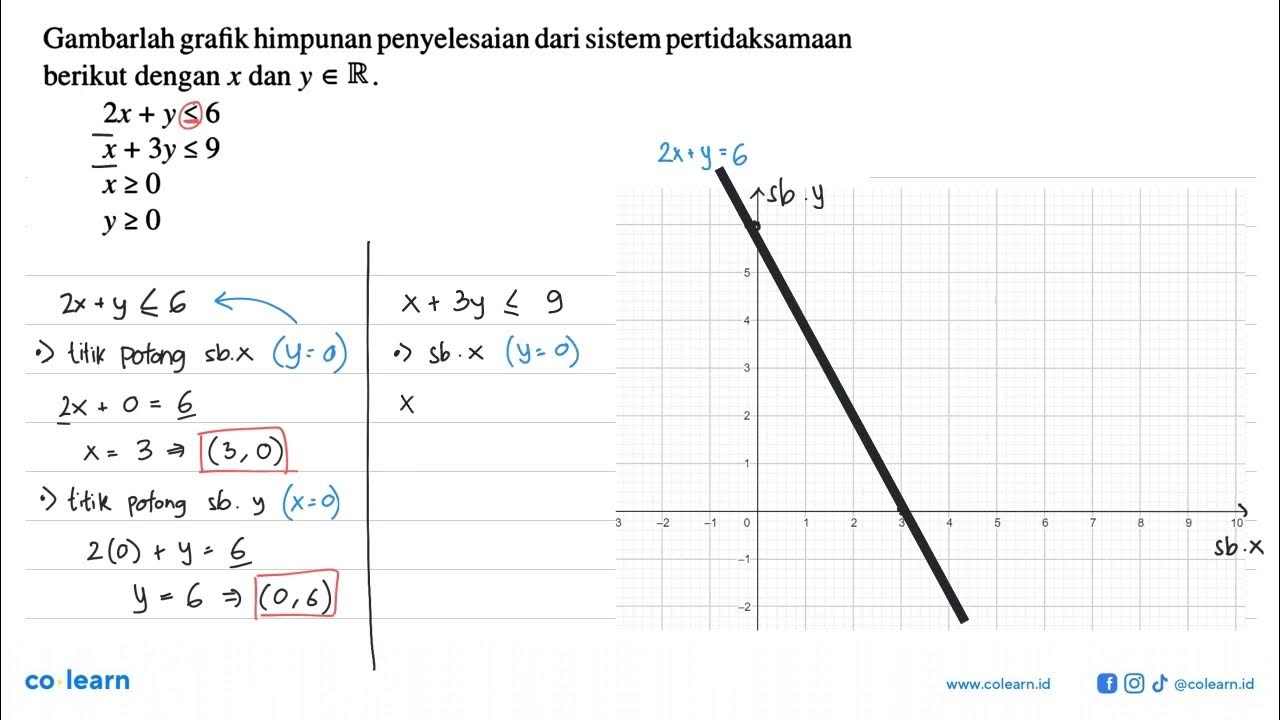
Gambarlah grafik himpunan penyelesaian dari sistem pertidaksamaan berikut dengan x dan y e R. 2x+...

Find a function’s output value when given an input value

Kalkulus - 3 7 1 Part 1 Metode Lagrange dan contoh
TRANSFORMASI FUNGSI TRANSLASI

Menentukan Nilai Optimum Menggunakan Metode Uji Titik Sudut (Uji Titik Pojok)

Linear Programming - Graphical Solution | Don't Memorise
5.0 / 5 (0 votes)
