Analisis Korelasi - Matematika Wajib SMA Kelas XI Kurikulum Merdeka
Summary
TLDRThis video introduces Correlation Analysis, focusing on understanding the relationship between two variables and assessing the strength of that relationship. The lecturer explains methods like using scatter plots to identify trends (linear or non-linear) and discusses the significance of correlation coefficients, including Pearson’s and Spearman’s. Students learn to analyze data through different correlation methods, helping them determine the strength of relationships between variables. This video serves as an introduction to correlation analysis and sets the stage for deeper exploration of Pearson’s and Spearman’s methods in future lessons.
Takeaways
- 😀 The video discusses the topic of correlation analysis in statistics for class 11, specifically focusing on the correlation between two variables.
- 😀 Correlation analysis helps determine if there is a relationship between two variables and how strong that relationship is.
- 😀 The script mentions that earlier content focused on identifying whether a relationship exists, but this video digs deeper into the strength of that relationship.
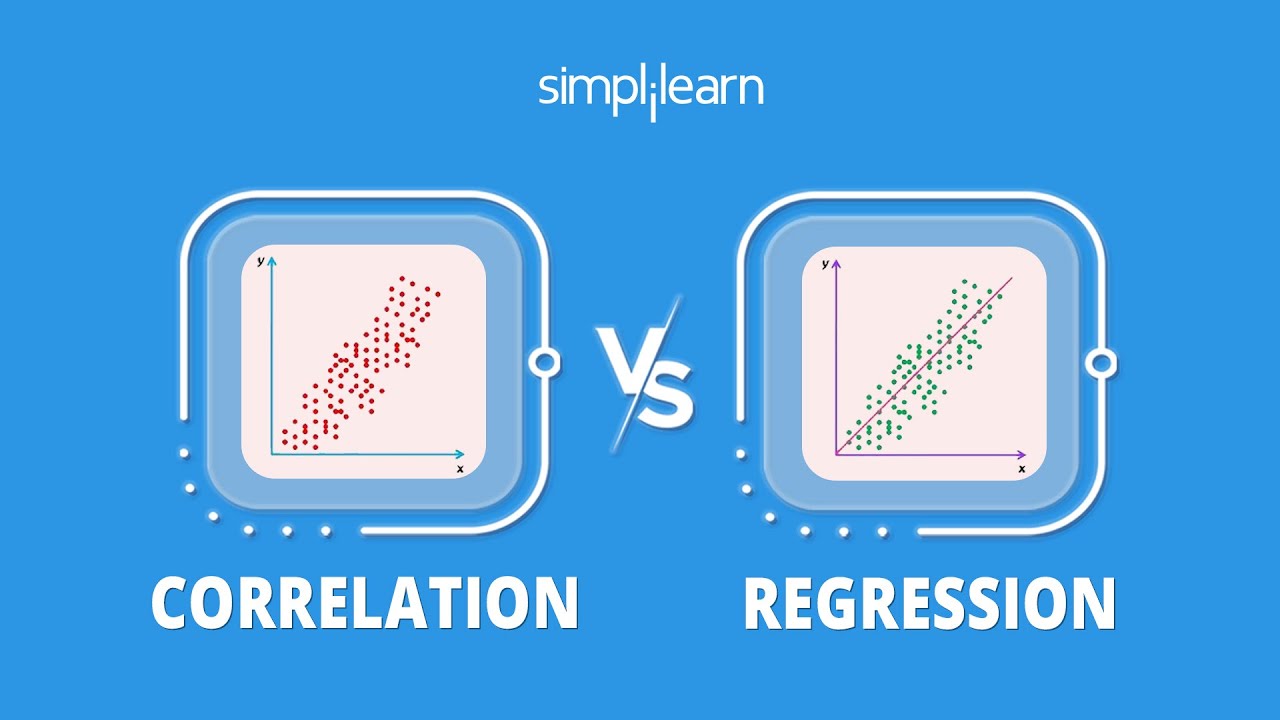
- 😀 The process of identifying correlation from a scatter plot involves looking for patterns such as linear or non-linear trends.
- 😀 If the scatter plot shows a rising line from left to right, the correlation is positive. A falling line indicates a negative correlation, while no pattern means no correlation.
- 😀 The strength of correlation is also addressed, explaining that there are methods to quantify how strong the relationship is between variables.
- 😀 The video mentions that this content is part of the final material on scatter plots and correlation analysis in the curriculum.
- 😀 A key method for determining correlation strength is using the correlation coefficient, also known as the coefficient of correlation.
- 😀 There are three primary methods to calculate the correlation coefficient: Pearson’s correlation, Spearman’s rank correlation, and Kendall’s rank correlation.
- 😀 Pearson’s and Spearman’s correlation methods are the most commonly used, while Kendall’s method is rarely used but still included for understanding.
- 😀 The selection of the appropriate method depends on the type of data and the analysis needs, with Pearson’s used for linear relationships and Spearman’s for rank-based analysis.
Q & A
What is the main topic of this video?
-The main topic of this video is correlation analysis, a statistical method used to determine if there is a relationship between two variables and the strength of that relationship.
What is correlation analysis?
-Correlation analysis is a statistical method used to assess the relationship between two variables and determine the strength of that relationship.
What is the key difference between correlation and correlation analysis?
-While correlation simply identifies whether two variables are related, correlation analysis goes further to measure the strength of that relationship.
How do you interpret the direction of a correlation from a scatter plot?
-The direction of a correlation in a scatter plot can be interpreted based on the trend of the data points. If the points follow an upward slope, the correlation is positive. If they follow a downward slope, the correlation is negative. If there is no clear trend, there is no correlation.
What does a positive correlation mean?
-A positive correlation means that as one variable increases, the other variable also increases. For example, if students' ages increase, the size of their shoes tends to increase as well.
What is the importance of calculating the correlation coefficient?
-The correlation coefficient is important because it quantifies the strength and direction of the relationship between two variables, allowing a more detailed analysis beyond visual inspection of a scatter plot.
What are the three methods to calculate the correlation coefficient mentioned in the video?
-The three methods to calculate the correlation coefficient are Pearson's correlation, Spearman's correlation, and Kendall's rank correlation. Pearson's is the most commonly used.
Why is the choice of correlation method important?
-The choice of correlation method is important because different methods are suitable for different types of data. Pearson’s correlation is commonly used for linear relationships, while Spearman’s correlation is used for rank-based relationships.
When is Spearman’s correlation preferred over Pearson’s?
-Spearman’s correlation is preferred when the data involves ranks or does not follow a linear relationship, whereas Pearson's is more suitable for linear relationships between continuous variables.
What is the purpose of this video in relation to the broader educational content?
-The purpose of this video is to introduce the concept of correlation analysis as part of a broader curriculum on Mathematics, specifically within the topic of scatter diagrams, and to prepare students for more advanced discussions on how to calculate and interpret correlation coefficients.
Outlines

このセクションは有料ユーザー限定です。 アクセスするには、アップグレードをお願いします。
今すぐアップグレードMindmap

このセクションは有料ユーザー限定です。 アクセスするには、アップグレードをお願いします。
今すぐアップグレードKeywords

このセクションは有料ユーザー限定です。 アクセスするには、アップグレードをお願いします。
今すぐアップグレードHighlights

このセクションは有料ユーザー限定です。 アクセスするには、アップグレードをお願いします。
今すぐアップグレードTranscripts

このセクションは有料ユーザー限定です。 アクセスするには、アップグレードをお願いします。
今すぐアップグレード関連動画をさらに表示
Correlation vs Regression | Difference Between Correlation and Regression | Statistics | Simplilearn

Statistik Teori pertemuan ke ~ 9 Korelasi dan Regresi
KULIAH STATISTIK - ANALISIS KORELASI

Regresi dan Korelasi Sederhana
Korelasi Product Moment (r) Hal 110-116 Bab 3 STATISTIK Kelas 11 SMA Kurikulum Merdeka
Part 18: Multiple Correlation of Coefficient | "r" and "R" Calculation | Biostatistics & RM
5.0 / 5 (0 votes)
