Ukuran Dispersi dan Variasi
Summary
TLDRThis educational video from the Universitas Pendidikan Indonesia delves into descriptive statistics, focusing on measures of dispersion and variation. It contrasts central tendency measures like mean, median, and mode with dispersion metrics, emphasizing the importance of understanding data spread. Through practical examples in educational settings and sports training, the presenter illustrates how to assess the homogeneity and heterogeneity of groups. Key concepts such as range, interquartile range, standard deviation, variance, skewness, and kurtosis are explored, enhancing comprehension of data variability. The video aims to equip viewers with analytical skills essential for interpreting statistical information.
Takeaways
- 😀 Understanding descriptive statistics is essential for analyzing student performance in educational settings.
- 📊 Measures of central tendency, such as mean, median, and mode, provide insights into average scores but do not reflect data variability.
- 📉 Dispersion and variation are critical for evaluating the consistency of understanding among students in different classes.
- 🏫 A comparison of two classes with the same average can reveal significant differences in student performance consistency.
- 🏅 Homogeneity in a class indicates that students have similar levels of understanding, making it easier to teach effectively.
- ⚽ In team sports, understanding individual skill levels through data dispersion can lead to better team selection for competitions.
- 📏 The range is the simplest measure of dispersion, calculated as the difference between the highest and lowest values.
- 🔍 The interquartile range (IQR) is more stable than the range, as it minimizes the influence of extreme values.
- 📐 Standard deviation and variance are more sophisticated measures that provide a deeper understanding of data distribution.
- 📈 Skewness and kurtosis help assess the shape of data distributions, informing researchers about data normality and outliers.
Q & A
What is the main topic of the video?
-The main topic of the video is descriptive statistics, specifically focusing on measures of central tendency and measures of dispersion or variation.
What are the measures of central tendency mentioned in the video?
-The measures of central tendency discussed in the video include mean, median, and mode.
How does the speaker differentiate between classes A and B?
-The speaker notes that both classes have the same average score, but class A is more homogeneous while class B is more heterogeneous, based on the spread of their scores.
What is the significance of dispersion in statistics?
-Dispersion helps in understanding how spread out the data points are around the central tendency. It reveals whether the data points are closely clustered or widely spread apart.
What does the term 'range' refer to in the context of this video?
-Range refers to the difference between the highest and lowest scores in a dataset.
Why is the range considered a limited measure of dispersion?
-The range is limited because it only considers the extreme values (the highest and lowest scores) and can be significantly affected by outliers.
What is the interquartile range (IQR) and how is it calculated?
-The interquartile range (IQR) is the difference between the third quartile (Q3) and the first quartile (Q1). It represents the range of the middle 50% of the data.
What is standard deviation, and why is it important?
-Standard deviation measures the average distance of each data point from the mean. It is important because it provides insight into the variability of the data.
How do skewness and kurtosis relate to data distribution?
-Skewness measures the asymmetry of the data distribution, while kurtosis measures the 'tailedness' of the distribution. Together, they provide a deeper understanding of the shape of the data distribution.
What practical implications does the speaker mention regarding differences in skill levels among teams?
-The speaker highlights that even if two teams have the same average skill level, a team with less variation in skill levels (lower standard deviation) may perform better overall because of the uniformity of skills among team members.
Outlines

このセクションは有料ユーザー限定です。 アクセスするには、アップグレードをお願いします。
今すぐアップグレードMindmap

このセクションは有料ユーザー限定です。 アクセスするには、アップグレードをお願いします。
今すぐアップグレードKeywords

このセクションは有料ユーザー限定です。 アクセスするには、アップグレードをお願いします。
今すぐアップグレードHighlights

このセクションは有料ユーザー限定です。 アクセスするには、アップグレードをお願いします。
今すぐアップグレードTranscripts

このセクションは有料ユーザー限定です。 アクセスするには、アップグレードをお願いします。
今すぐアップグレード関連動画をさらに表示

Descriptive Statistics [Simply explained]

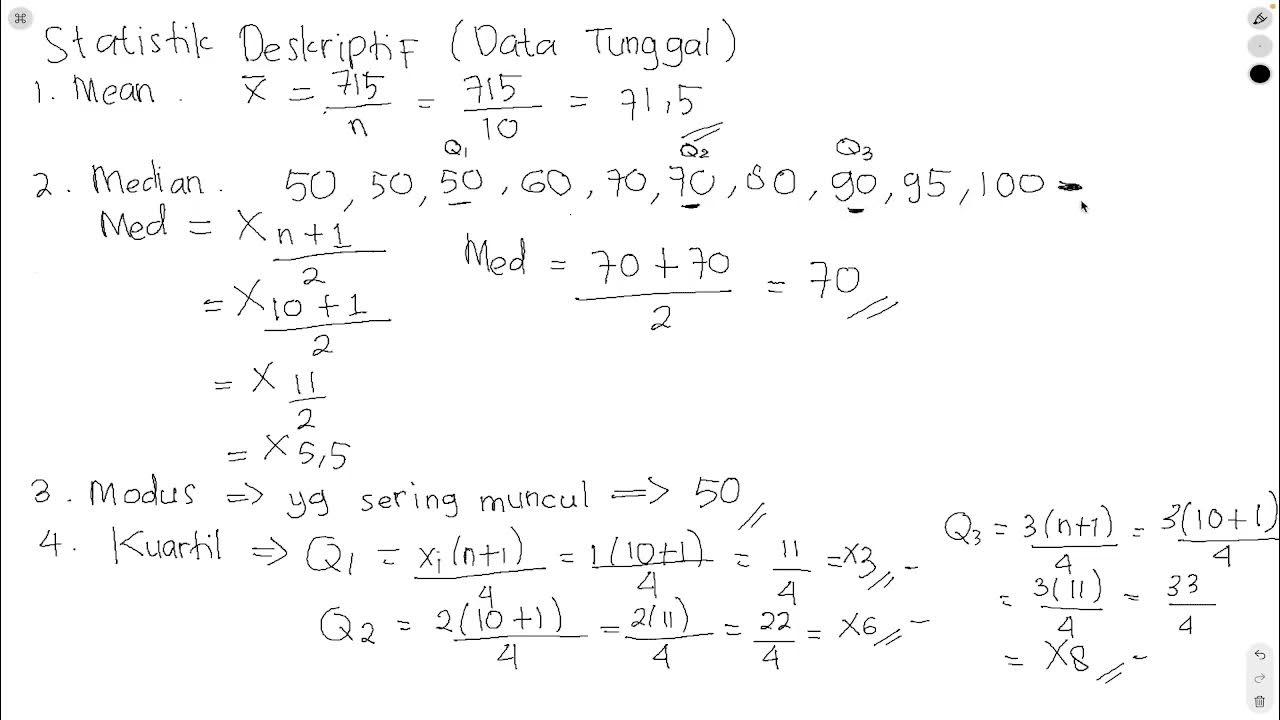
STATISTIK DESKRIPTIF (MEAN, MEDIAN, MODE, KUARTIL, VARIAN, STANDAR DEVIASI) UNTUK DATA TUNGGAL

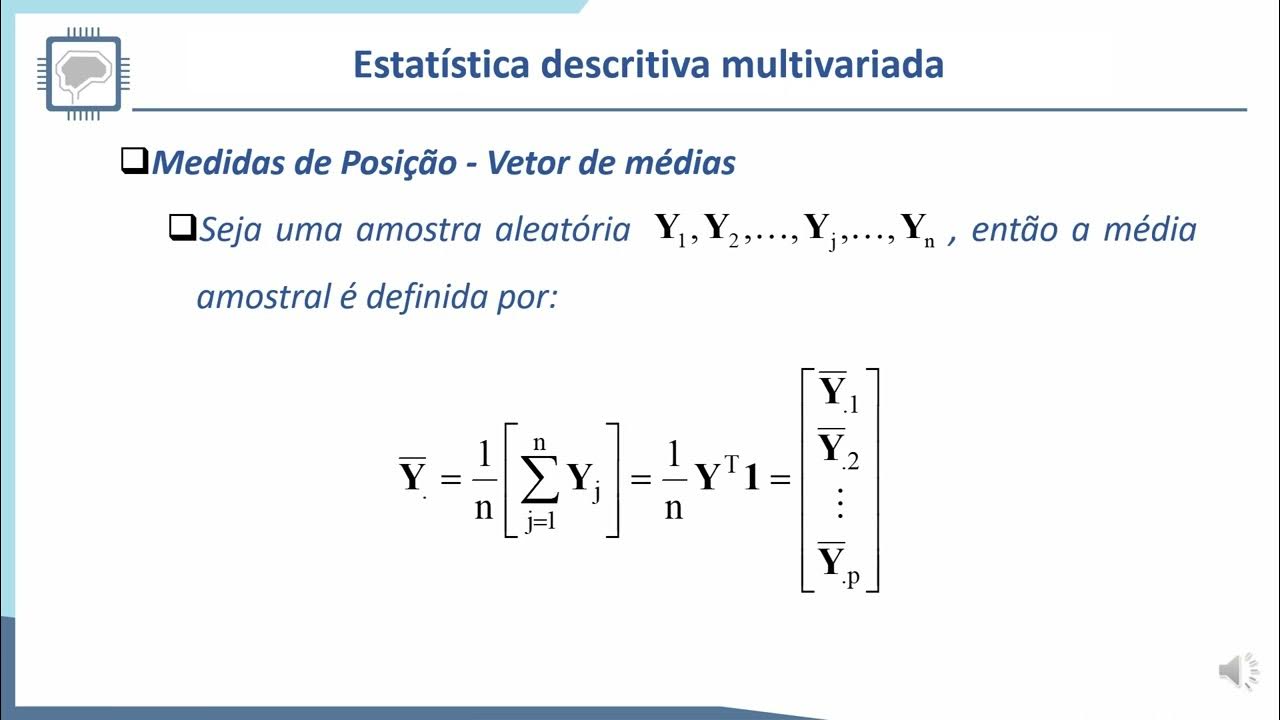
ELT573 AULA SLIDES TEORICA INTRODUÇÃO ESTATÍSTICA UNI MULTIVARIADA ACCN MN FINAL

Statistics - Module 3 - Numerical Summaries

Descriptive Statistics: FULL Tutorial - Mean, Median, Mode, Variance & SD (With Examples)

2.5 Medidas descriptivas
5.0 / 5 (0 votes)
