Confidence Interval for Mean with Example | Statistics Tutorial #10 | MarinStatsLectures
Summary
TLDRThis video covers the detailed process of constructing a confidence interval for a population mean, using an example of BMI data from Vancouver. It discusses the necessary assumptions, including the need for a simple random sample, independent observations, and a sufficiently large or normally distributed sample. The video demonstrates calculating a 95% and 99% confidence interval, explaining the concepts of margin of error, two-sided vs. one-sided intervals, and the use of Z and T values. The importance of understanding these concepts, even when using software for calculations, is emphasized.
Takeaways
- 📊 The video focuses on constructing a confidence interval for a population mean using an example involving BMI data from Vancouver.
- ✅ Assumptions for using the confidence interval formula include having a simple random sample, independent observations, and a large enough sample size (usually 20+).
- 📉 When the population follows a normal distribution, a large sample size isn't necessary for the confidence interval to be valid.
- ⚠️ The confidence interval calculation is sensitive to outliers, as they can skew the mean and inflate the standard deviation.
- 🔢 The example shows constructing a 95% confidence interval for a sample with a mean BMI of 25.2 and a standard deviation of 5, resulting in an interval of 22.7 to 27.7.
- 📐 The rough value of 2 standard deviations was used, but the exact t-value should be 2.13, slightly adjusting the confidence interval.
- 🎟️ A lottery analogy explains why we say we're 95% confident the true population mean is within the interval, rather than claiming a 95% chance.
- 📈 A 99% confidence interval was also constructed, resulting in a range of 21.97 to 28.43 for the BMI data.
- 🔄 One-sided confidence intervals can provide just an upper or lower bound. In this case, an upper bound of 27.25 was found using a 95% confidence level.
- 🛠️ The video emphasizes that future confidence interval calculations will often use software, so understanding the concepts is more important than manual calculations.
Q & A
What is the purpose of constructing a confidence interval for a population mean in the given example?
-The purpose is to estimate the population mean BMI for Vancouverites based on a sample. The confidence interval provides a range in which the true population mean is likely to fall with a certain level of confidence (95% in this case).
What assumptions are necessary to construct a confidence interval using the provided formula?
-The assumptions include having a simple random sample, independent observations, and either a large enough sample size (typically greater than 20) or a population that follows an approximately normal distribution.
How does sample size affect the construction of a confidence interval?
-A larger sample size makes the confidence interval more reliable. A smaller sample can be acceptable if the population distribution is symmetric, but a skewed distribution requires a larger sample size for accurate results.
What is the rough guideline for sample size when constructing confidence intervals?
-The rough guideline is that the sample size should be greater than 20, though this can vary based on how symmetric or skewed the population distribution is.
How is the standard error calculated in the confidence interval formula?
-The standard error is calculated by dividing the sample standard deviation (5 in this case) by the square root of the sample size (which is 16).
What is the difference between a two-sided and a one-sided confidence interval?
-A two-sided confidence interval provides both an upper and lower bound for the population mean, while a one-sided confidence interval only gives an upper or lower bound, depending on the focus of the estimation.
Why is the T-distribution used instead of the Z-distribution when constructing confidence intervals for small sample sizes?
-The T-distribution is used because it accounts for the additional uncertainty introduced by smaller sample sizes, especially when the sample size is less than 30.
What does it mean to be '95% confident' that the population mean falls within the confidence interval?
-It means that if we were to take many samples and construct confidence intervals for each, we would expect 95% of those intervals to contain the true population mean.
What is the importance of understanding the margin of error in a confidence interval?
-The margin of error indicates the range of uncertainty around the sample estimate. A larger margin of error suggests less precision in the estimate, while a smaller margin indicates a more precise estimate of the population mean.
How does the analogy of the lottery ticket help explain the concept of confidence intervals?
-The lottery ticket analogy illustrates that the population mean is fixed and either falls within the interval or does not. We don’t know for certain if the interval contains the true mean, but we can be 95% confident based on the sampling process.
Outlines

このセクションは有料ユーザー限定です。 アクセスするには、アップグレードをお願いします。
今すぐアップグレードMindmap

このセクションは有料ユーザー限定です。 アクセスするには、アップグレードをお願いします。
今すぐアップグレードKeywords

このセクションは有料ユーザー限定です。 アクセスするには、アップグレードをお願いします。
今すぐアップグレードHighlights

このセクションは有料ユーザー限定です。 アクセスするには、アップグレードをお願いします。
今すぐアップグレードTranscripts

このセクションは有料ユーザー限定です。 アクセスするには、アップグレードをお願いします。
今すぐアップグレード関連動画をさらに表示

Student's T Distribution - Confidence Intervals & Margin of Error
STATPRO - 10 Point and Interval Estimate of population Mean
Confidence Interval Concept Explained | Statistics Tutorial #7 | MarinStatsLectures
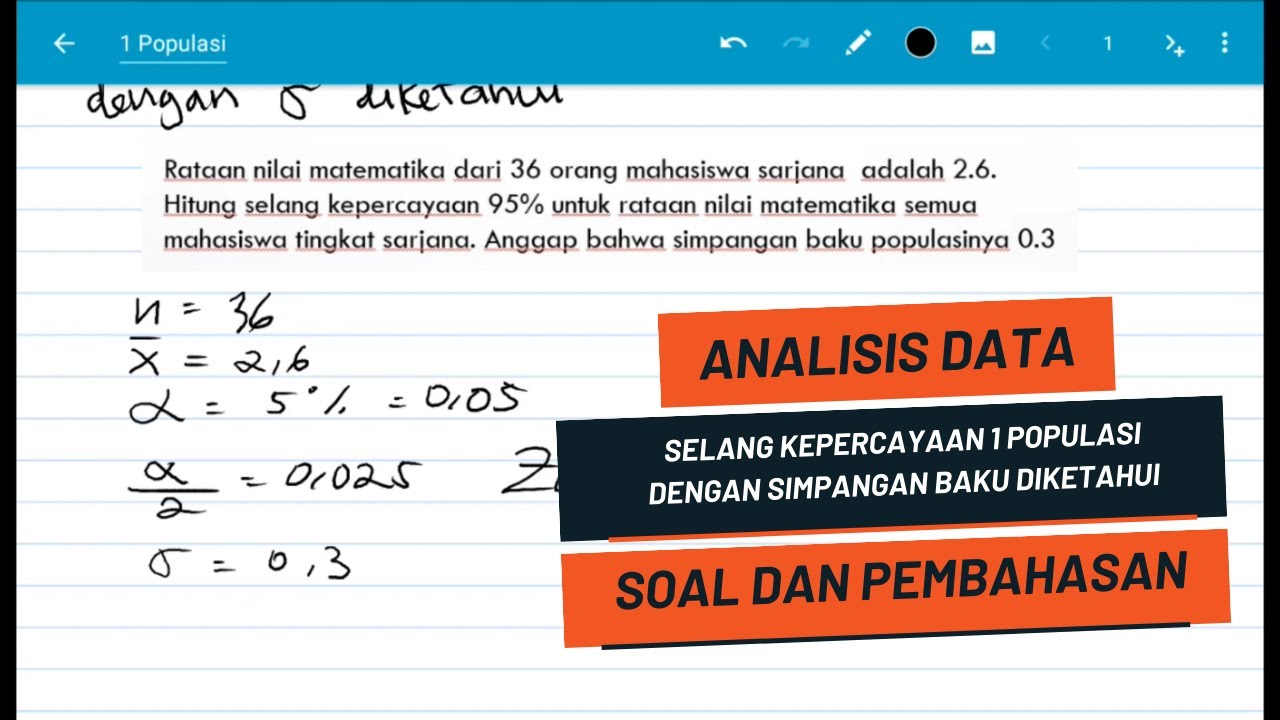
(Analisis Data) Soal Pembahasan Selang Kepercayaan Rataan 1 Populasi Dengan Simpangan Baku Diketahui
Hypothesis Test vs. Confidence Interval | Statistics Tutorial #15 | MarinStatsLectures
Intervalo de Confiança para a MÉDIA (μ) com variância populacional desconhecida
5.0 / 5 (0 votes)
