(Analisis Data) Soal Pembahasan Selang Kepercayaan Rataan 1 Populasi Dengan Simpangan Baku Diketahui
Summary
TLDRIn this video, the presenter discusses how to calculate the confidence interval for the mean of a population, specifically focusing on a sample of 36 students with an average score of 2.6. The video explains how to use the standard deviation (0.3) and the z-value (1.96) for a 95% confidence level to compute the interval. Step-by-step, the presenter demonstrates the formula and calculation process, ultimately arriving at the confidence interval range of 2.502 to 2.698. The video concludes by confirming the result's validity, showing that the population mean lies within this interval.
Takeaways
- 😀 The video discusses how to calculate a 95% confidence interval for the mean of a population with a known standard deviation.
- 😀 The problem involves the average math score of 36 undergraduate students, which is 2.6.
- 😀 The standard deviation of the population is given as 0.3.
- 😀 The significance level (alpha) for a 95% confidence interval is 0.05, and the alpha/2 value is 0.025.
- 😀 The z-value for 0.025 in a normal distribution is 1.96, which can be found in the standard normal table.
- 😀 The formula for the confidence interval is: Mean ± (z * (Standard Deviation / √n)).
- 😀 Substituting the known values into the formula, we calculate the confidence interval boundaries.
- 😀 The lower boundary of the confidence interval is 2.502, and the upper boundary is 2.698.
- 😀 To verify the result, the calculated confidence interval (2.502 to 2.698) includes the given average score of 2.6.
- 😀 The video concludes that the result is correct, as the sample mean (2.6) lies within the calculated confidence interval.
- 😀 The overall explanation and steps are geared towards helping viewers understand how to calculate and verify a confidence interval in statistical analysis.
Q & A
What is the main topic of the video?
-The main topic of the video is about calculating the confidence interval for the mean of a population, specifically for a sample of 36 students' mathematics scores.
What is the sample size (n) provided in the problem?
-The sample size (n) is 36 students.
What is the mean value (X̄) of the mathematics scores for the sample?
-The mean value (X̄) of the mathematics scores is 2.6.
What confidence level is used in this problem?
-A 95% confidence level is used in this problem.
What is the value of alpha (α) in the context of the confidence interval?
-Alpha (α) is 0.05, which corresponds to a 95% confidence level.
How is alpha divided in the context of the confidence interval?
-Alpha is divided by 2, resulting in α/2 = 0.025.
What is the z-score value for α/2 = 0.025?
-The z-score value for α/2 = 0.025 is 1.96, which can be found from the standard normal distribution table.
What is the population standard deviation (σ) used in this calculation?
-The population standard deviation (σ) is 0.3.
What is the formula used to calculate the confidence interval for the population mean?
-The formula used is: Confidence Interval = X̄ ± Z * (σ / √n), where X̄ is the sample mean, Z is the z-score, σ is the population standard deviation, and n is the sample size.
What are the final confidence interval limits for the population mean?
-The final confidence interval limits are 2.502 and 2.698.
How do we verify if the sample mean (X̄) lies within the calculated confidence interval?
-We check if the sample mean (X̄), which is 2.6, lies between the lower limit (2.502) and upper limit (2.698) of the confidence interval. Since 2.6 is within this range, the calculation is correct.
Outlines

This section is available to paid users only. Please upgrade to access this part.
Upgrade NowMindmap

This section is available to paid users only. Please upgrade to access this part.
Upgrade NowKeywords

This section is available to paid users only. Please upgrade to access this part.
Upgrade NowHighlights

This section is available to paid users only. Please upgrade to access this part.
Upgrade NowTranscripts

This section is available to paid users only. Please upgrade to access this part.
Upgrade NowBrowse More Related Video
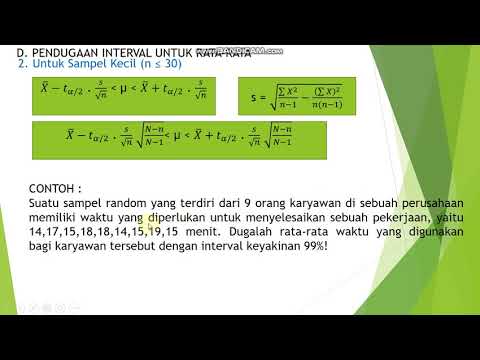
17 pendugaan interval rata rata sampel kecil

Student's T Distribution - Confidence Intervals & Margin of Error

Intervalo de Confiança para a MÉDIA (μ) com variância populacional desconhecida
Pendugaan Interval untuk rata rata sampel besar n lebih 30

Confidence Interval Concept Explained | Statistics Tutorial #7 | MarinStatsLectures

Intervalo de Confiança para a Média Populacional (μ) com variância populacional conhecida
5.0 / 5 (0 votes)