T1 Relaxation, Spin-lattice Relaxation, Longitudinal Recovery | MRI Physics Course #5
Summary
TLDRThis educational video explores T1 relaxation in MRI, contrasting it with T2 relaxation. It explains T1 as spin-lattice interaction, where spins realign with the main magnetic field, regaining longitudinal magnetization. The video uses the analogy of a room with people and chairs to illustrate the concept and discusses how different tissues like fat and CSF have varying T1 relaxation times. It further explains how MRI machines use these differences to create T1-weighted images, highlighting the importance of understanding T1 and T2 relaxation for medical imaging.
Takeaways
- 🧲 T1 relaxation, also known as spin lattice relaxation, involves the interaction of spins with the lattice (non-spin components like proteins and macromolecules), leading to realigning with the main magnetic field and gaining longitudinal magnetization.
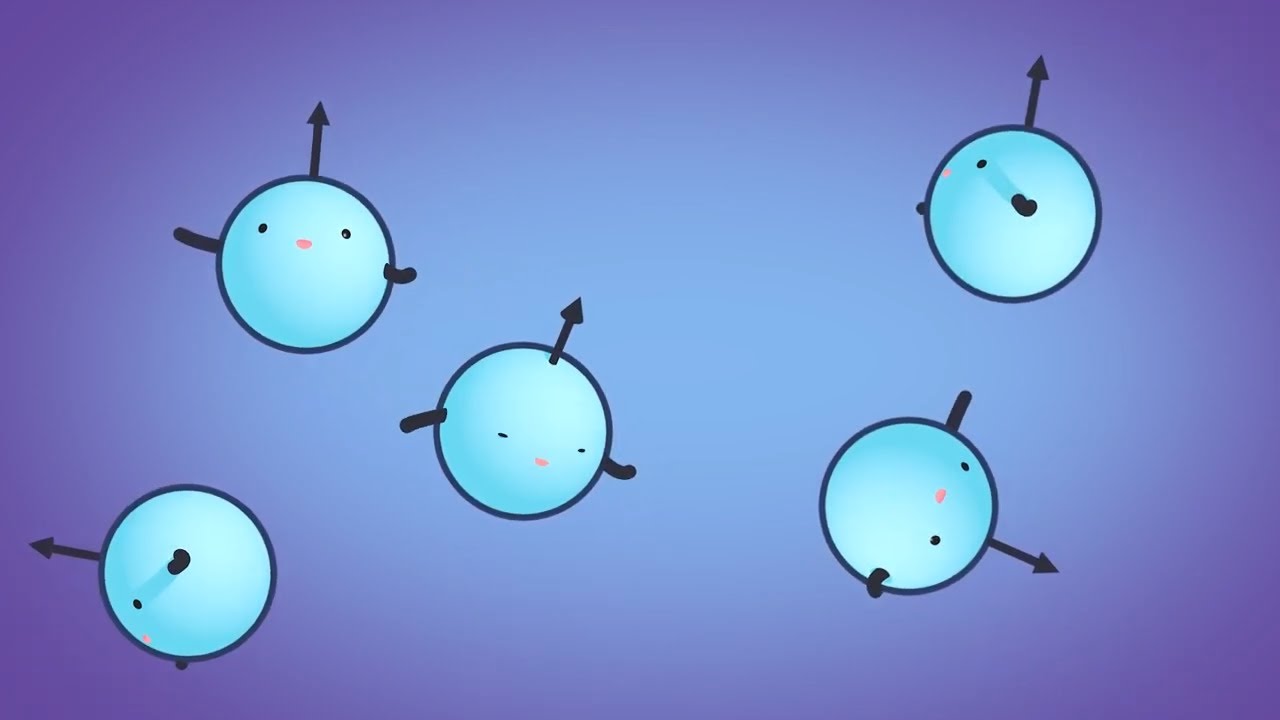
- 🌀 T2 relaxation, in contrast to T1, is about the loss of transverse magnetization due to spin-spin interactions causing de-phasing of the spins.
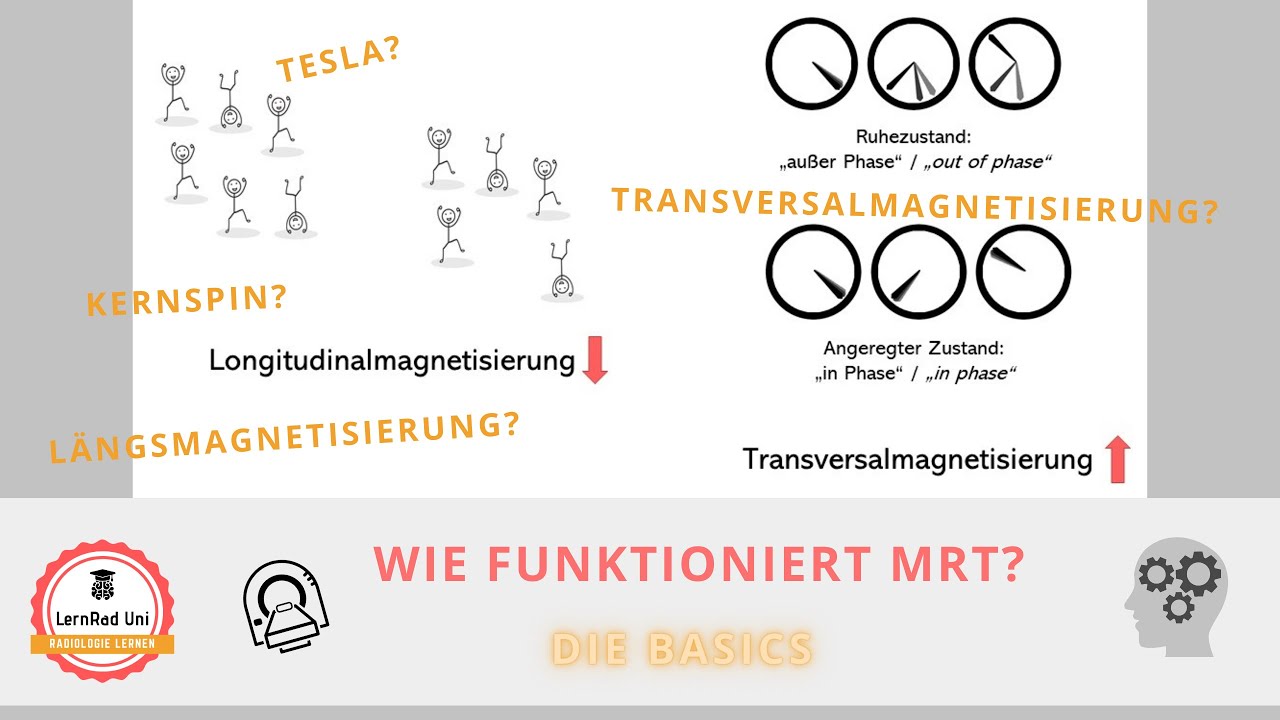
- 📈 T1 relaxation is associated with longitudinal recovery, where the net longitudinal magnetization is regained, as opposed to T2 relaxation, which is about transverse decay.
- 🚫 The rate of T1 relaxation varies among different tissues, with factors such as the presence of proteins or macromolecules influencing how quickly spins realign with the B0 field.
- 🧼 Fat tissues regain longitudinal magnetization more quickly due to their structure and the presence of more lattice components, unlike CSF which has fewer proteins and thus slower T1 relaxation.
- 📉 The T1 time constant measures the time it takes to regain 63% of the longitudinal magnetization vector, and it varies significantly between different types of tissues.
- 🌐 T1 contrast in MRI images is achieved by manipulating the time to repetition (TR) in the pulse sequence, which affects how much longitudinal magnetization different tissues have regained by the time of the next RF pulse.
- 🔄 The absence of T1 star relaxation compared to T2 star is due to the nature of how magnetic field inhomogeneities affect longitudinal versus transverse magnetization.
- 📊 By adjusting TR and TE (time to echo), MRI pulse sequences can be tailored to emphasize either T1 or T2 contrast, or a balance between them, known as proton density weighting.
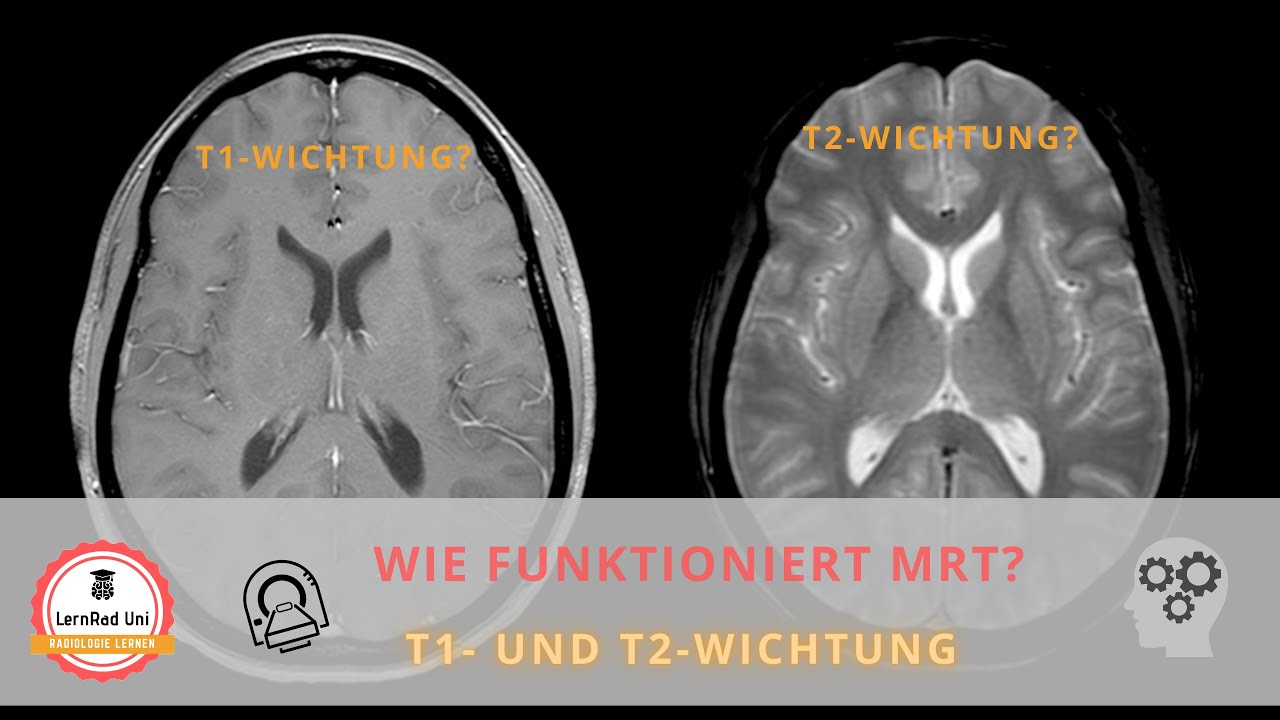
- 📸 In T1-weighted MRI images, tissues with shorter T1 times, like fat, appear brighter, while those with longer T1 times, like CSF, appear darker.
Q & A
What is T1 relaxation in MRI?
-T1 relaxation, also known as spin lattice relaxation, is the process by which the spins in a tissue realign with the main magnetic field after being perturbed, such as by a radio frequency pulse. This realignment results in the recovery of longitudinal magnetization.
How does T1 relaxation differ from T2 relaxation?
-T1 relaxation involves the recovery of longitudinal magnetization, whereas T2 relaxation involves the loss of transverse magnetization due to de-phasing of spins. T2 relaxation is often referred to as transverse decay.
What is meant by the 'lattice' in the context of T1 relaxation?
-The 'lattice' refers to the structural components, such as macromolecules and proteins, that do not have spin themselves but interact with the spins, causing them to realign with the main magnetic field.
Why is T1 relaxation also known as longitudinal recovery?
-T1 relaxation is known as longitudinal recovery because it involves the recovery of longitudinal magnetization as the spins realign with the main magnetic field.
How does the presence of the lattice affect T1 relaxation?
-The presence of the lattice, or non-spin components, influences the rate at which spins realign with the main magnetic field, thus affecting the speed of T1 relaxation.
What is the significance of the T1 time constant in MRI?
-The T1 time constant represents the time it takes for a tissue to regain 63% of its longitudinal magnetization. It is a key parameter used to differentiate between tissues in MRI based on their T1 relaxation properties.
Why does fat appear differently than CSF in T1-weighted MRI images?
-Fat regains longitudinal magnetization more quickly than CSF due to the presence of more lattice components and the nature of its triglyceride chains, which results in a brighter signal in T1-weighted images.
How does the time to repetition (TR) affect T1 contrast in MRI images?
-A short TR time allows less time for longitudinal magnetization recovery, highlighting T1 differences between tissues. A longer TR time allows more time for recovery, reducing T1 contrast differences.
What is the role of time to echo (TE) in T2 relaxation, and how does it differ from its role in T1 relaxation?
-In T2 relaxation, TE is the time at which the transverse magnetization signal is measured, and it affects the visibility of T2 contrast. In T1 relaxation, TE is less relevant because the focus is on longitudinal magnetization, which cannot be directly measured.
Why is there no T1 star relaxation effect as there is with T2 star relaxation?
-T1 star relaxation does not occur because the magnetic field inhomogeneities that cause extra decay in T2 relaxation do not significantly affect the longitudinal magnetization recovery process in T1 relaxation.
Outlines

このセクションは有料ユーザー限定です。 アクセスするには、アップグレードをお願いします。
今すぐアップグレードMindmap

このセクションは有料ユーザー限定です。 アクセスするには、アップグレードをお願いします。
今すぐアップグレードKeywords

このセクションは有料ユーザー限定です。 アクセスするには、アップグレードをお願いします。
今すぐアップグレードHighlights

このセクションは有料ユーザー限定です。 アクセスするには、アップグレードをお願いします。
今すぐアップグレードTranscripts

このセクションは有料ユーザー限定です。 アクセスするには、アップグレードをお願いします。
今すぐアップグレード関連動画をさらに表示

T1, T2 and Proton Density Weighting | MRI Weighting and Contrast | MRI Physics Course #6
Wie funktioniert MRT? T1 und T2 Wichtung
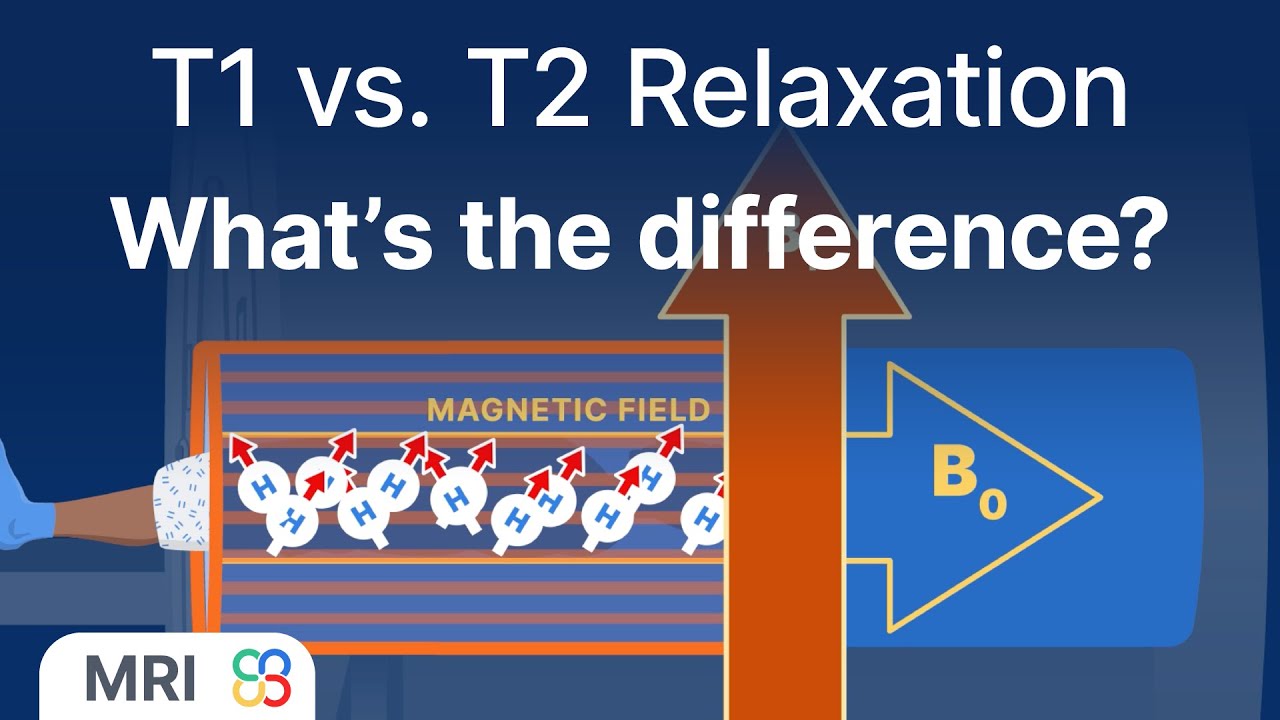
What’s the difference between T1 and T2 relaxation? - MRI physics explained
T2 Relaxation, Spin-spin Relaxation, Free Induction Decay, Transverse Decay | MRI Physics Course #4
MRI Physics | Magnetic Resonance and Spin Echo Sequences - Johns Hopkins Radiology
Wie funktioniert MRT? Die Basics
5.0 / 5 (0 votes)
