T2 Relaxation, Spin-spin Relaxation, Free Induction Decay, Transverse Decay | MRI Physics Course #4
Summary
TLDRThis educational video script delves into the intricacies of nuclear magnetic resonance (NMR) and relaxation processes in MRI. It explains how protons align in an external magnetic field and resonate at a specific frequency. The script then focuses on T2 relaxation, detailing the loss of transverse magnetization due to spin-spin interactions and the impact of magnetic field inhomogeneities. It uses the analogy of spinning basketballs to illustrate dephasing and discusses T2 star decay, highlighting the differences between T2 and T2 star relaxation times. The script also explores how T2 relaxation curves vary across tissues and the role of echo time (TE) in MRI imaging, emphasizing its importance in generating tissue contrast.
Takeaways
- 🧲 The process of nuclear magnetic resonance (NMR) involves placing protons in an external magnetic field, causing them to align and resonate at a specific frequency.
- 🌀 A radiofrequency (RF) pulse is applied perpendicular to the magnetic field, causing protons to resonate in phase and fan out from the longitudinal magnetization vector.
- 🔄 At 90 degrees, the net magnetization vector transitions from longitudinal to transverse, resulting in maximum transverse magnetization.
- 📉 T2 relaxation refers to the loss of transverse magnetization, which occurs due to dephasing of spins as the RF pulse is stopped.
- 🏀 Spin-spin relaxation, characterized by the dephasing of spins due to interactions, is a key component of T2 relaxation, with the rate depending on the tissue type.
- 🌐 T2 star decay accounts for the loss of signal due to both spin-spin interactions and magnetic field inhomogeneities, which are not solely due to spin interactions.
- 🛑 The MRI scanner's inability to create a perfectly homogeneous magnetic field contributes to T2 star decay, along with the presence of substances in the patient and local magnetic field disruptions.
- 🔄 A 180-degree RF pulse can be used to rephase spins that have dephased, effectively compensating for magnetic field inhomogeneities and recovering the T2 relaxation signal.
- 📊 T2 relaxation curves vary by tissue type, with water or CSF showing less dephasing and thus slower signal loss compared to fat, which has more rapid signal decay.
- ⏱ Adjusting the time to echo (TE) in MRI can manipulate the contrast between tissues by highlighting differences in T2 relaxation times, allowing for clearer differentiation in imaging.
Q & A
What is nuclear magnetic resonance (NMR)?
-Nuclear magnetic resonance is a process where protons within an external magnetic field align with that field and resonate at a set frequency. A radiofrequency magnetic pulse is applied, causing the protons to start resonating in phase with one another, leading to a loss of longitudinal magnetization and a gain of transverse magnetization.
What are the two types of relaxation processes discussed in the script?
-The two types of relaxation processes discussed are T2 relaxation, which is the loss of transverse magnetization, and T1 relaxation, which is the regaining of longitudinal magnetization.
What is meant by 'spin-spin relaxation'?
-Spin-spin relaxation refers to the loss of transverse magnetization that occurs as protons or spins go out of phase with one another after the radio frequency pulse is stopped. This dephasing is primarily caused by interactions between the spins themselves.
How does the composition of fat affect its T2 relaxation?
-Fat, composed of long chains of triglycerides, allows the molecules to bump into each other easily, leading to more frequent interactions between spins. This results in a quicker loss of phase and faster T2 relaxation, causing a rapid decrease in signal compared to tissues like CSF.
What is the significance of the T2 star decay in MRI?
-T2 star decay in MRI accounts for the loss of signal due to both spin-spin interactions and magnetic field inhomogeneities. It is a measurable decay that occurs more quickly in tissues than the ideal T2 decay, which is solely due to spin-spin interactions.
Why do magnetic field inhomogeneities affect the T2 star decay?
-Magnetic field inhomogeneities affect the T2 star decay because they cause protons at different locations to experience varying magnetic field strengths, leading to different precession rates and increased dephasing, which in turn accelerates the loss of transverse magnetization.
How does the 180-degree radio frequency pulse help in compensating for magnetic field inhomogeneities?
-The 180-degree radio frequency pulse refocuses the dephasing spins by flipping their phase, allowing the faster and slower precessing spins to realign. This effectively compensates for the local field inhomogeneities, leading to a re-phasing of the spins and an increase in the transverse magnetization vector.
What is the purpose of the time to echo (TE) in MRI?
-The time to echo (TE) in MRI is the time interval between the 90-degree RF pulse and the point at which the signal is sampled. It is crucial for controlling the contrast in the image by highlighting differences in T2 relaxation times between various tissues.
How does the choice of TE affect the MRI image contrast?
-A shorter TE results in a higher signal but less contrast between tissues, as the differences in T2 relaxation times are not fully expressed. A longer TE allows for greater distinction between tissues based on their T2 relaxation properties, increasing the contrast in the image.
What is the relationship between T2 relaxation and the appearance of different tissues in MRI?
-T2 relaxation times vary between different tissues, with some tissues like CSF having longer T2 times and appearing brighter, while others like muscle have shorter T2 times and appear darker. The MRI image contrast is directly influenced by these T2 differences.
Outlines

This section is available to paid users only. Please upgrade to access this part.
Upgrade NowMindmap

This section is available to paid users only. Please upgrade to access this part.
Upgrade NowKeywords

This section is available to paid users only. Please upgrade to access this part.
Upgrade NowHighlights

This section is available to paid users only. Please upgrade to access this part.
Upgrade NowTranscripts

This section is available to paid users only. Please upgrade to access this part.
Upgrade NowBrowse More Related Video
Spin, Precession, Resonance and Flip Angle | MRI Physics Course | Radiology Physics Course #3
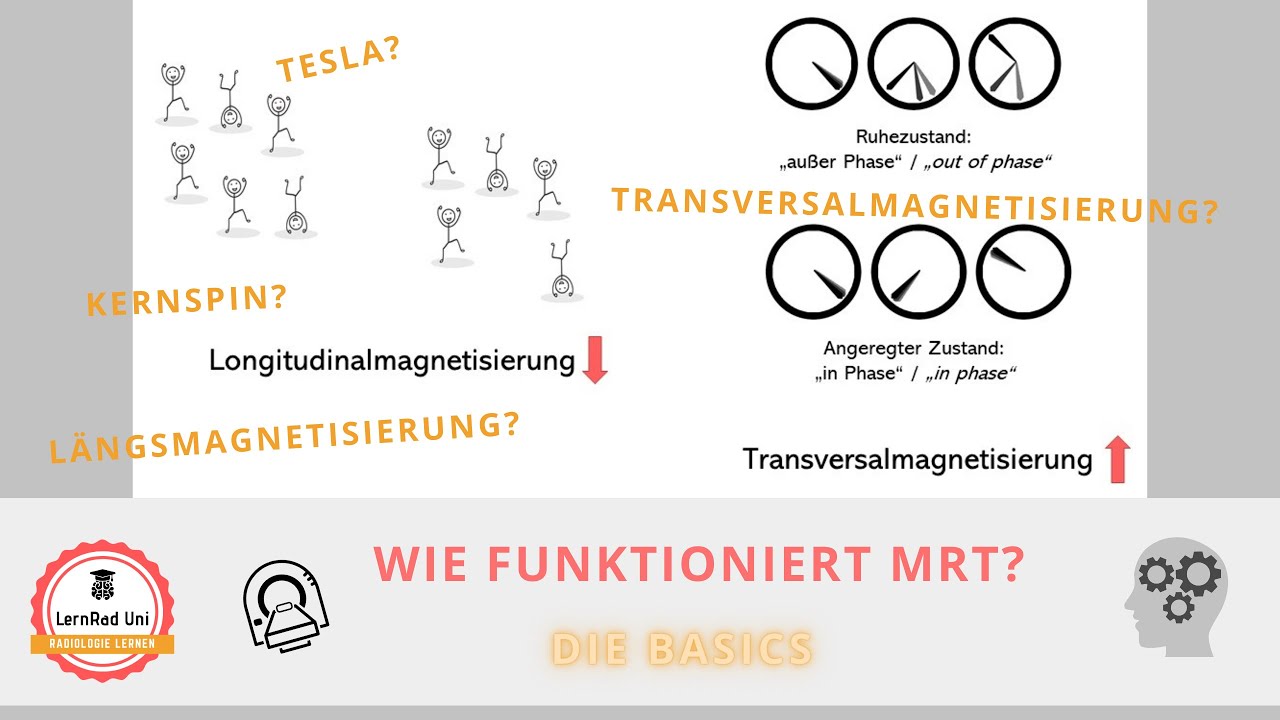
Wie funktioniert MRT? Die Basics
Introductory NMR & MRI: Video 01: Precession and Resonance
Prinsip Dasar Magnetic Resonance Imaging (MRI) #MRI
MRI Machine - Main, Gradient and RF Coils/ Magnets | MRI Physics Course | Radiology Physics Course#2

NMR.part1
5.0 / 5 (0 votes)