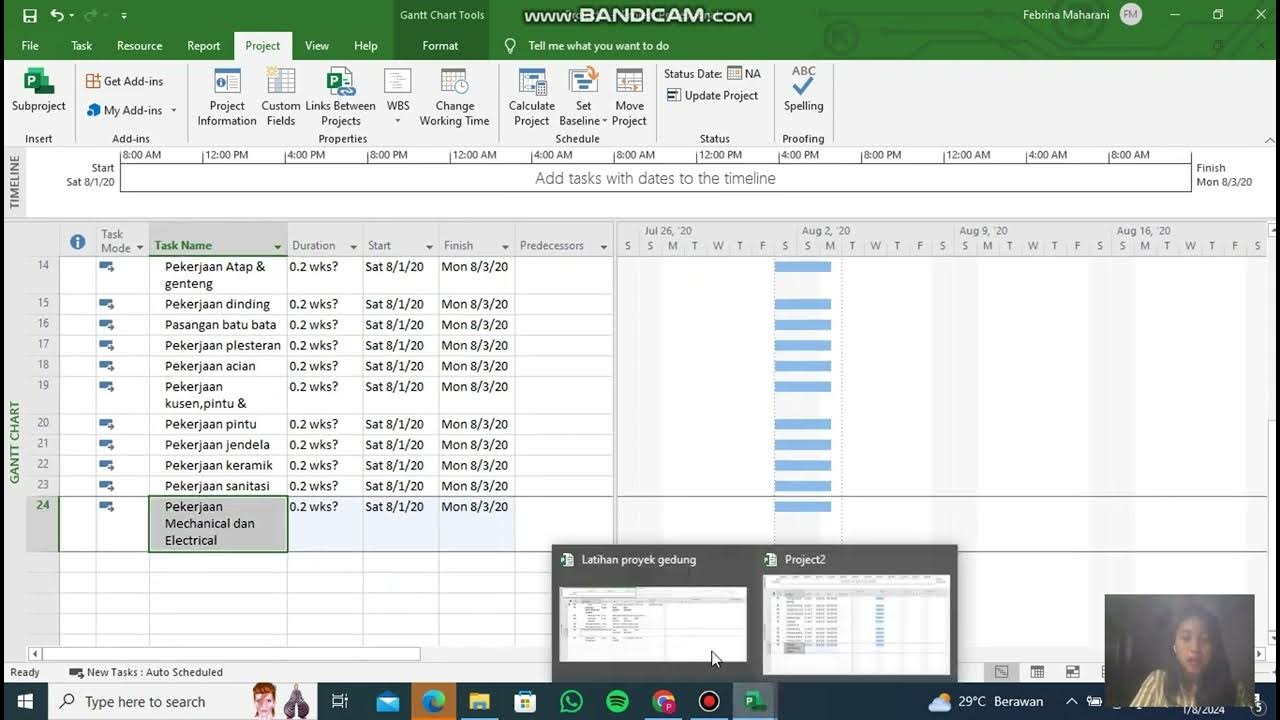
Create Gantt Chart | Oracle APEX - Part 30
Summary
TLDRTech Mining's video tutorial introduces Gantt charts for project planning, highlighting their ability to streamline complex projects by scheduling tasks, identifying dependencies, and calculating minimum delivery times. The guide demonstrates creating a Gantt chart using a table with SQL queries, loading data from a CSV file, and configuring chart properties to visualize task progress and dependencies. The final result showcases a dynamic chart that updates project status, offering a clear overview of completion and schedules.
Takeaways
- 📈 A Gantt chart is a tool for effectively planning complex projects by listing all tasks, their start dates, duration, and dependencies.
- 📅 It helps in determining the minimum delivery time for a project and scheduling resources when they are available.
- 🔍 To create a Gantt chart, you start by creating a table and populating it with relevant project data.
- 🔗 The source code for the Gantt chart functionality is provided in the video description for further reference.
- 💾 The process involves running a query to create a 'project table' in the workspace schema and loading data from a CSV file.
- 🖥️ Access the 'data load and unload' page to load data into the project table using a specified CSV file.
- 📊 After loading the data, you can view and interact with the table to ensure the data is correctly appended.
- 📝 Open the sales web application to start creating the Gantt chart by selecting the 'chart' option and then 'Gantt'.
- 🔑 Define the start and end dates, task ID, task name, and other properties for the Gantt chart using column mapping.
- 📈 Set the 'status' column to map progress on the Gantt chart, indicating the task's completion status.
- 🔄 Use the zoom buttons to navigate the Gantt chart, viewing tasks at different scales for better understanding.
- 📊 The Gantt chart visually represents the project's progress, with same-day tasks in diamond shapes, completed tasks in dark blue, and remaining tasks in light blue.
Q & A
What is the main purpose of a Gantt chart in project management?
-A Gantt chart is used to effectively plan complex projects by enabling the planning of all tasks in one place, helping to determine the minimum delivery time for the project, and scheduling when the right people are available to complete the tasks.
How does a Gantt chart help in planning project tasks?
-A Gantt chart helps by listing all the tasks needed to complete a project, specifying the earliest start date for each activity, estimating the duration of each task, and identifying dependencies between tasks.
What is the first step in creating a Gantt chart as described in the script?
-The first step is to create a table and populate it with relevant data, which includes tasks, start dates, durations, and dependencies.
Where can I find the source code for creating a Gantt chart as mentioned in the video?
-The source code can be found in the description of the video, with a link provided there.
How do you load data into the project table in the script?
-You access the data load and unload page, click the load data button, choose the project table CSV file from the part 8 folder, select the existing table option, and then click the load data button.
What does the message 'data in table project table appended with 73 new rows' indicate?
-This message indicates that the data loading process was successful, and 73 new rows of data have been added to the project table.
How can you view the data in the project table after loading it?
-You can view the data by clicking the 'view table' button at the bottom of the data load confirmation screen.
What is the role of the 'chart option' in the sales web application?
-The 'chart option' in the sales web application allows users to select and configure different types of charts, including the Gantt chart, for visualizing project data.
What are the column mappings needed to define a Gantt chart in the script?
-The column mappings needed include start date, end date, task ID, task name, task start date, and task end date.
How is the task progress represented on the Gantt chart in the script?
-The task progress is represented by the 'status' column, which defines the progress of each task on the Gantt chart.
What visual cues are used in the Gantt chart to represent different task statuses?
-Same day tasks are shown in diamond shapes, completed tasks are represented in dark blue color, and remaining tasks are displayed in light blue colors.
How can you get more details about a specific task on the Gantt chart?
-You can get more details about a specific task by hovering the mouse pointer over the task bar on the Gantt chart.
Outlines

Cette section est réservée aux utilisateurs payants. Améliorez votre compte pour accéder à cette section.
Améliorer maintenantMindmap

Cette section est réservée aux utilisateurs payants. Améliorez votre compte pour accéder à cette section.
Améliorer maintenantKeywords

Cette section est réservée aux utilisateurs payants. Améliorez votre compte pour accéder à cette section.
Améliorer maintenantHighlights

Cette section est réservée aux utilisateurs payants. Améliorez votre compte pour accéder à cette section.
Améliorer maintenantTranscripts

Cette section est réservée aux utilisateurs payants. Améliorez votre compte pour accéder à cette section.
Améliorer maintenant5.0 / 5 (0 votes)


