STATISTIKA - Cara mudah menentukan nilai Jangkauan, Jangkauan antarkuartil dan Simpangan kuartil
Summary
TLDRThis tutorial provides a step-by-step guide on calculating essential statistical measures—range, interquartile range (IQR), and quartile deviation. Using a simple data set, it explains how to determine the range by subtracting the smallest value from the largest, calculates the IQR by finding the difference between the first and third quartiles, and shows how to compute the quartile deviation as half of the IQR. The tutorial is beginner-friendly, with clear examples and easy-to-understand explanations for each concept.
Takeaways
- 😀 The video teaches basic statistics concepts, including range, interquartile range (IQR), and quartile deviation (simpangan kuartil).
- 😀 Always start by sorting the data from smallest to largest to simplify further calculations.
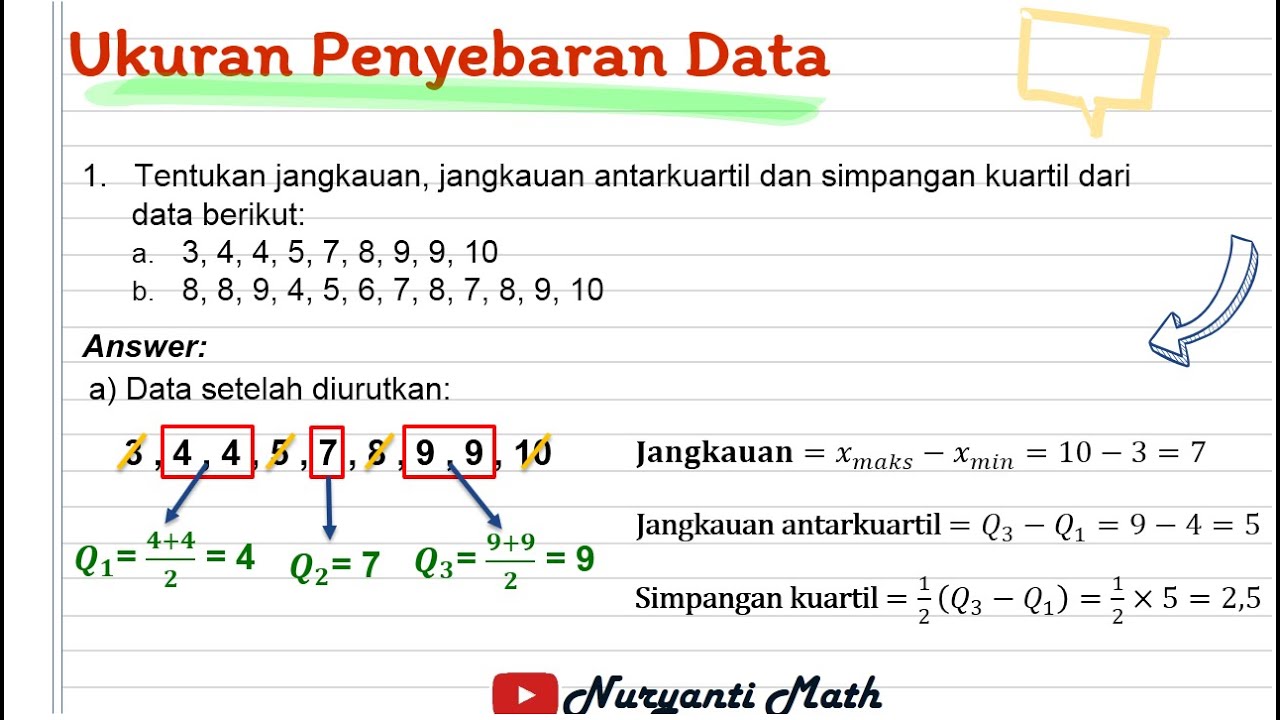
- 😀 The range is calculated by subtracting the smallest value (Xmin) from the largest value (Xmax) in the data set.
- 😀 The formula for calculating the range is: Range = Xmax - Xmin.
- 😀 To calculate the interquartile range (IQR), first find the first (Q1) and third (Q3) quartiles.
- 😀 The interquartile range (IQR) is calculated by subtracting Q1 from Q3: IQR = Q3 - Q1.
- 😀 Quartiles Q1 and Q3 divide the data into four equal parts, and Q2 is the median or middle value.
- 😀 Quartile 1 (Q1) is the median of the lower half of the data, and Quartile 3 (Q3) is the median of the upper half.
- 😀 The quartile deviation is calculated using the formula: Simpangan Kuartil = (Q3 - Q1) / 2.
- 😀 By following these simple steps, you can easily calculate the range, interquartile range, and quartile deviation for any data set.
Q & A
What is the range in statistics, and how is it calculated?
-The range in statistics is the difference between the largest and smallest values in a dataset. It is calculated using the formula: Range = Xmax - Xmin, where Xmax is the largest value and Xmin is the smallest value in the dataset.
How do you calculate the interquartile range (IQR)?
-The interquartile range (IQR) is calculated by finding the difference between the third quartile (Q3) and the first quartile (Q1). The formula is: IQR = Q3 - Q1. Q1 is the median of the lower half of the data, and Q3 is the median of the upper half.
What is the first step in calculating the range for a dataset?
-The first step in calculating the range is to arrange the data in ascending order, from the smallest value to the largest value. Once the data is ordered, the range can be calculated by subtracting the smallest value from the largest value.
What is the significance of quartiles in statistics?
-Quartiles divide a dataset into four equal parts, providing insight into the distribution of the data. Q1 represents the first 25% of the data, Q2 (the median) represents the middle 50%, and Q3 represents the top 75% of the data.
How do you find the value of Q1 and Q3 in a dataset?
-To find Q1 and Q3, first split the dataset into two halves: the lower half (values below the median) and the upper half (values above the median). Q1 is the median of the lower half, and Q3 is the median of the upper half.
How is the quartile deviation calculated?
-The quartile deviation is calculated using the formula: Quartile Deviation = (Q3 - Q1) / 2. It measures the spread of the middle 50% of the data and provides an indication of data variability.
What is the importance of ordering the data before finding quartiles?
-Ordering the data ensures that the quartiles are calculated correctly, as quartiles divide the data into specific percentile groups. Without sorting the data, the quartile values would be inaccurate.
What is the relationship between Q1, Q2, and Q3 in a dataset?
-Q1, Q2, and Q3 are the three quartiles that divide the dataset into four equal parts. Q1 is the 25th percentile, Q2 is the 50th percentile (median), and Q3 is the 75th percentile. Together, they provide insights into the distribution of the data.
Why do we calculate both the range and the interquartile range?
-The range gives a simple measure of the spread of the entire dataset, while the interquartile range (IQR) focuses on the middle 50% of the data, making it less sensitive to outliers and better suited for understanding the distribution of typical values.
How do you determine the median when the dataset has an odd number of values?
-When the dataset has an odd number of values, the median is the middle value after the data has been sorted in ascending order. In this case, there is only one value in the center, which becomes the median.
Outlines

Cette section est réservée aux utilisateurs payants. Améliorez votre compte pour accéder à cette section.
Améliorer maintenantMindmap

Cette section est réservée aux utilisateurs payants. Améliorez votre compte pour accéder à cette section.
Améliorer maintenantKeywords

Cette section est réservée aux utilisateurs payants. Améliorez votre compte pour accéder à cette section.
Améliorer maintenantHighlights

Cette section est réservée aux utilisateurs payants. Améliorez votre compte pour accéder à cette section.
Améliorer maintenantTranscripts

Cette section est réservée aux utilisateurs payants. Améliorez votre compte pour accéder à cette section.
Améliorer maintenantVoir Plus de Vidéos Connexes
Ukuran Penyebaran Data (Jangkauan, Jangkauan Antarkuartil, Simpangan Kuartil) - STATISTIKA Kelas 8

Ukuran Penyebaran Data | Statistika Kelas 8

Ukuran Penyebaran Data Tunggal | Statistika Matematika Wajib Kelas 12 | Catatan Matematika @Bang-RP
STATISTIKA - Kuartil, Jangkauan, Jangkauan Antar Kuartil Dan Simpangan Kuartil Data Tunggal
JANGKAUAN, HAMPARAN, SIMPANGAN KUARTIL, SIMPANGAN RATA RATA, RAGAM DAN STANDAR DEVIASI

UKURAN PENYEBARAN (DATA TUNGGAL)
5.0 / 5 (0 votes)
