Intip 4 Rahasia Trading Price Action ini! Dijamin Trading Tambah PeDe
Summary
TLDRThis video delves into the fundamentals of trading using price action rather than lagging indicators like Moving Averages, RSI, and MACD. It highlights four key secrets: the tendency for price to return to its average, the impact of small pullbacks on trend continuation, how large candlestick bodies signal strong momentum, and the role of market momentum in predicting future price movements. The video also emphasizes using support and resistance levels for successful trading, offering practical insights on how to read market behavior and avoid common mistakes in technical analysis.
Takeaways
- 😀 Price indicators like Moving Average, MACD, and RSI are lagging indicators, providing signals after price movements have already occurred.
- 😀 The use of price action is essential for traders, as it helps identify trends directly from the market price without relying on lagging indicators.
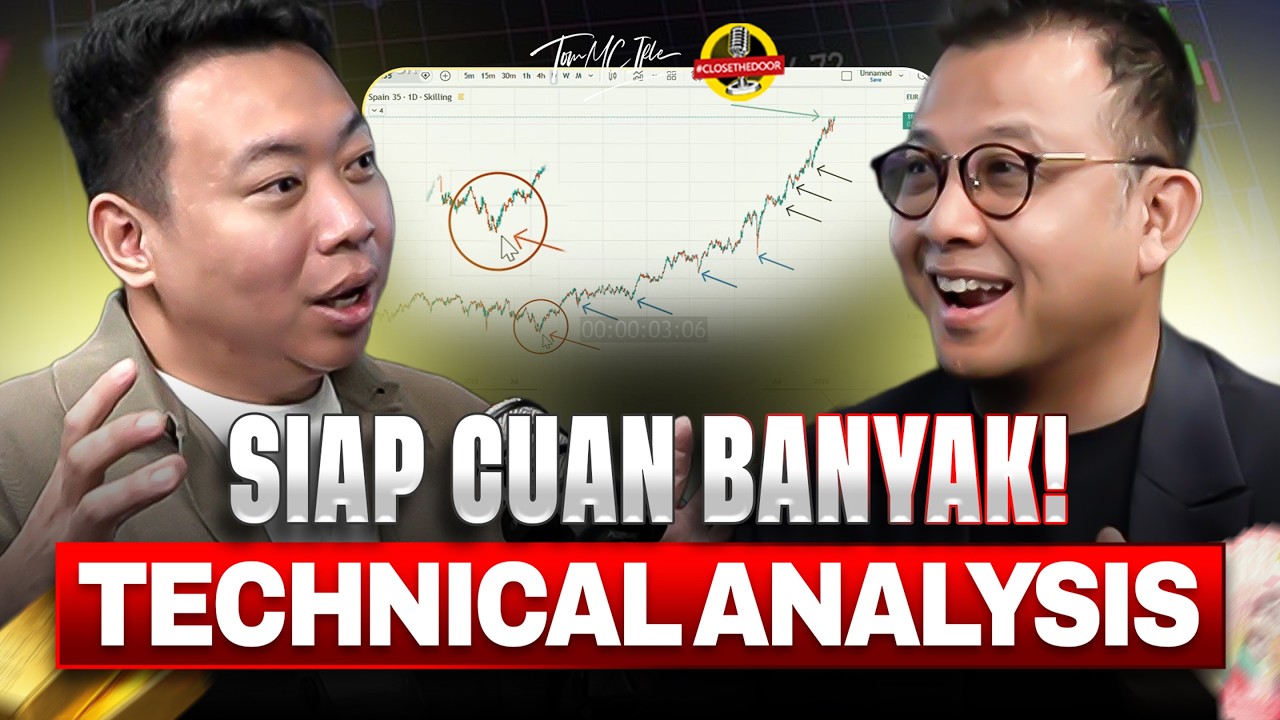
- 😀 Price rarely moves far from the average price. The EMA 50 acts as a magnet, pulling the price back towards the average after large moves.
- 😀 Smaller pullbacks indicate stronger market potential, suggesting that the trend will continue after the pullback, as fewer traders are taking profits.
- 😀 Larger pullbacks suggest significant profit-taking, which can lead to slower market movements or a trend reversal.
- 😀 Large candlesticks (either bullish or bearish) signal strong market moves and are often followed by price continuation in the same direction.
- 😀 Small candlesticks with long wicks indicate indecision in the market, leading to consolidation or sideways movement.
- 😀 Momentum plays a crucial role in predicting future price movements. Sharp, steep price moves indicate strong momentum and a higher likelihood of continuation.
- 😀 When approaching key support or resistance levels, traders should watch for candle size and color changes to gauge potential market reactions.
- 😀 Avoid entering trades when candles are growing larger as they approach support or resistance levels, as this can signal strong momentum in the opposite direction.
- 😀 Combining price action with support and resistance levels can significantly enhance a trader's ability to predict market movements and improve trading accuracy.
Q & A
What are lagging indicators and why are they considered less effective in trading?
-Lagging indicators, such as Moving Averages, MACD, and RSI, are based on past market data, which means they provide signals after price movements have already occurred. This delay can lead to missed opportunities, as trades may be entered too late, resulting in suboptimal profit or even losses.
How does Price Action trading differ from using indicators?
-Price Action trading focuses on analyzing price movements directly on the chart using candlestick patterns, without relying on lagging indicators. It helps traders identify market conditions, trends, and potential reversals by observing real-time price movements and the actions of buyers and sellers.
What is the role of EMA 50 in Price Action trading?
-EMA 50 (Exponential Moving Average) represents the average price over a set period (50 periods) and acts as a key level or 'magnet' for price. In an uptrend or downtrend, price tends to revert back to the EMA after moving too far away, which can indicate pullbacks or reversals.
How does a small pullback relate to future price movement?
-A small pullback suggests that fewer traders are taking profits, which means the market remains attractive for further buying. As a result, the price is more likely to continue in the same direction, leading to a stronger price movement afterward.
Why is Fibonacci used in analyzing pullbacks?
-Fibonacci retracements help identify potential support or resistance levels during a pullback. By comparing the size of a pullback to Fibonacci levels, traders can assess whether the pullback is shallow (indicating strong market momentum) or deep (indicating weaker momentum and potential for reversal).
What does a large candlestick body indicate in Price Action?
-A large candlestick body, either bullish (green) or bearish (red), indicates strong market participation and momentum. A large body with little or no wick suggests that one side (buyers or sellers) is in control, making it likely that the price will continue in that direction.
What does a small candle size indicate in terms of market sentiment?
-A small candle size indicates indecision in the market, where neither buyers nor sellers dominate. This often leads to consolidation or sideways market movement, suggesting that the price may stay within a range for a while.
How do market momentum and steep price movements influence future price action?
-Steep price movements with sharp angles indicate strong momentum, often suggesting that the trend will continue in the same direction. Conversely, if momentum weakens and price movement flattens, it signals potential for a reversal or sideways movement.
What are the key elements to look for when trading with Price Action and SNR (Support and Resistance)?
-When using Price Action with SNR levels, it's important to look for smaller candlesticks as the price approaches key support or resistance levels. Additionally, a change in candle color (from bearish to bullish or vice versa) signals a potential reversal. Avoid trading when candles are large and continuing to grow at these levels, as this often signals the price may break through support or resistance.
Why should traders avoid entering trades when candles become larger near support or resistance levels?
-Larger candles near support or resistance levels suggest that momentum is building in the opposite direction (either buying at support or selling at resistance). This could lead to a breakout of the level, and entering the trade might result in losses if the price continues beyond the support or resistance zone.
Outlines

Cette section est réservée aux utilisateurs payants. Améliorez votre compte pour accéder à cette section.
Améliorer maintenantMindmap

Cette section est réservée aux utilisateurs payants. Améliorez votre compte pour accéder à cette section.
Améliorer maintenantKeywords

Cette section est réservée aux utilisateurs payants. Améliorez votre compte pour accéder à cette section.
Améliorer maintenantHighlights

Cette section est réservée aux utilisateurs payants. Améliorez votre compte pour accéder à cette section.
Améliorer maintenantTranscripts

Cette section est réservée aux utilisateurs payants. Améliorez votre compte pour accéder à cette section.
Améliorer maintenantVoir Plus de Vidéos Connexes
Ubah Chart jadi Cuan Dengan Technical Analysis! Langsung Praktek

Moving Average Trading Secrets (This is What You Must Know...)

10. Technical indicators

Profit $38,960 Hidden Trading Secret: The Moving Average and RSI Strategy

The #1 Trading Indicator on TradingView

The ONLY 2 indicators I use to make $2,134/Day Trading
5.0 / 5 (0 votes)
