Skewness
Summary
TLDRIn this video, the concept of skewness in data sets is explored, focusing on how symmetry affects the distribution of data. The coefficient of skewness is introduced with a formula to measure it, showing how positive, negative, or zero skewness indicates different types of distributions. Real-life examples are provided, including student exam scores, to demonstrate how the position of the mean, median, and mode reflects the distribution. Viewers are guided through solving examples, with interpretations of skewness guiding the classification of data as normal, negatively skewed, or positively skewed.
Takeaways
- 😀 Skewness is a measure used to describe the symmetry of a data set, indicating whether it is symmetrical or not.
- 😀 The formula for calculating skewness is: SK = 3 * (mean - median) / standard deviation.
- 😀 A skewness value of zero means the data set is normally distributed, where the mean equals the median.
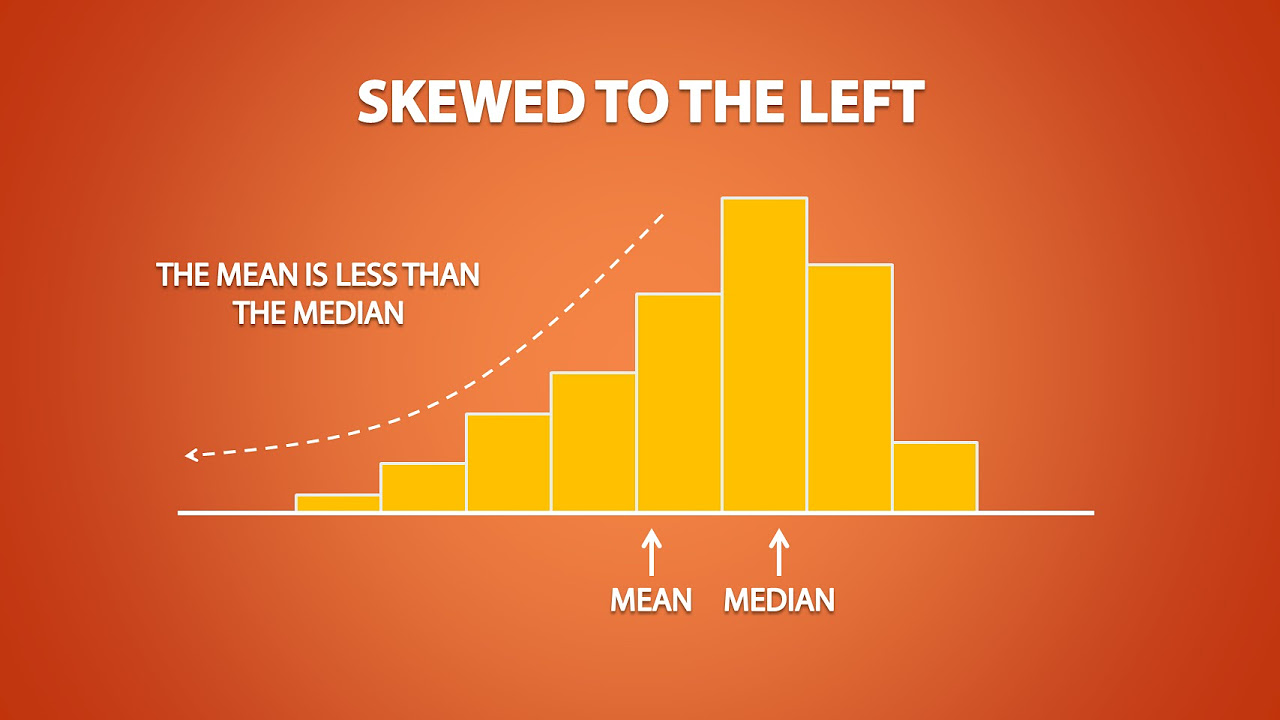
- 😀 A negative skewness value (less than 0) indicates that the data is negatively skewed (skewed to the left), where the mean is less than the median.
- 😀 A positive skewness value (greater than 0) indicates that the data is positively skewed (skewed to the right), where the mean is greater than the median.
- 😀 In a normal distribution, the mean, median, and mode are equal, and the distribution is symmetric.
- 😀 A negatively skewed distribution has a longer left tail, indicating a higher frequency of higher scores.
- 😀 A positively skewed distribution has a longer right tail, indicating a higher frequency of lower scores.
- 😀 The position of the tail in a distribution (left or right) tells whether it is skewed to the left or right.
- 😀 The coefficient of skewness can be used to determine the nature of the distribution based on whether the value is zero (normal), negative (left skewed), or positive (right skewed).
- 😀 Practical examples were provided to calculate the skewness coefficient and interpret different data sets (normal, negatively skewed, positively skewed).
Q & A
What is skewness in a data set?
-Skewness is a measure that describes the asymmetry of a data set. It indicates how data points are distributed relative to the mean, helping to identify if the data set is symmetrical or has a tail on one side.
How is the coefficient of skewness calculated?
-The coefficient of skewness (sk) is calculated using the formula: sk = 3 * (mean - median) / standard deviation. This formula helps quantify the skewness of a data set.
What does a skewness of zero mean?
-A skewness of zero indicates a normal distribution, where the mean, median, and mode are all equal, and the data set is perfectly symmetrical.
What does a negative skewness value indicate?
-A negative skewness value indicates a left-skewed distribution, meaning the left tail is longer, and there are more lower scores in the data set compared to higher ones.
What does a positive skewness value indicate?
-A positive skewness value indicates a right-skewed distribution, meaning the right tail is longer, and there are more higher scores in the data set compared to lower ones.
What are the three types of skewness based on the coefficient?
-The three types of skewness are: 1) Normal distribution (skewness = 0), 2) Negative skewness (skewness < 0), and 3) Positive skewness (skewness > 0).
What does the position of the tail in a distribution tell us?
-The position of the tail indicates the direction of skewness. A tail on the left suggests left skewness (negative), and a tail on the right suggests right skewness (positive).
What does a negatively skewed distribution look like?
-In a negatively skewed distribution, the left side of the graph is longer (tail to the left), and there are fewer low scores compared to high scores, which are more frequent.
How is skewness interpreted in the context of student exam scores?
-In the context of student exam scores, a negatively skewed distribution means more students scored higher than lower. A positively skewed distribution means more students scored lower than higher.
In the second example, why was the skewness value calculated as zero?
-In the second example, the mean and median were both 26, so when subtracted, the result was zero. This made the numerator of the skewness formula zero, leading to a skewness value of zero, indicating a normal distribution.
Outlines

Cette section est réservée aux utilisateurs payants. Améliorez votre compte pour accéder à cette section.
Améliorer maintenantMindmap

Cette section est réservée aux utilisateurs payants. Améliorez votre compte pour accéder à cette section.
Améliorer maintenantKeywords

Cette section est réservée aux utilisateurs payants. Améliorez votre compte pour accéder à cette section.
Améliorer maintenantHighlights

Cette section est réservée aux utilisateurs payants. Améliorez votre compte pour accéder à cette section.
Améliorer maintenantTranscripts

Cette section est réservée aux utilisateurs payants. Améliorez votre compte pour accéder à cette section.
Améliorer maintenant


5.0 / 5 (0 votes)
