INTRO TO BIG DATA AND AI MEET 14
Summary
TLDRIn this video, Aisyah guides students through a regression task in machine learning, explaining how to predict continuous values using advertising data. The tutorial covers the process of importing data, visualizing relationships between variables like TV, radio, and newspaper ad spending, and building a regression model. Aisyah demonstrates how to split data for training and testing, interpret model coefficients, and make predictions. The video emphasizes the simplicity of linear regression and its ability to predict sales based on advertising costs, although it may not always yield the most accurate results. The evaluation of model performance will be covered in the next session.
Takeaways
- 😀 Data prediction in machine learning can be categorized into regression and classification tasks. This lecture focuses on regression tasks.
- 😀 Regression tasks involve predicting continuous values, such as sales or costs, based on input data like advertising spend on different platforms.
- 😀 The dataset in the example contains variables such as TV, Radio, and Newspaper advertising spend, with the goal of predicting sales based on these inputs.
- 😀 The data is read into a Pandas DataFrame, which allows for easy manipulation and analysis of the data in Python.
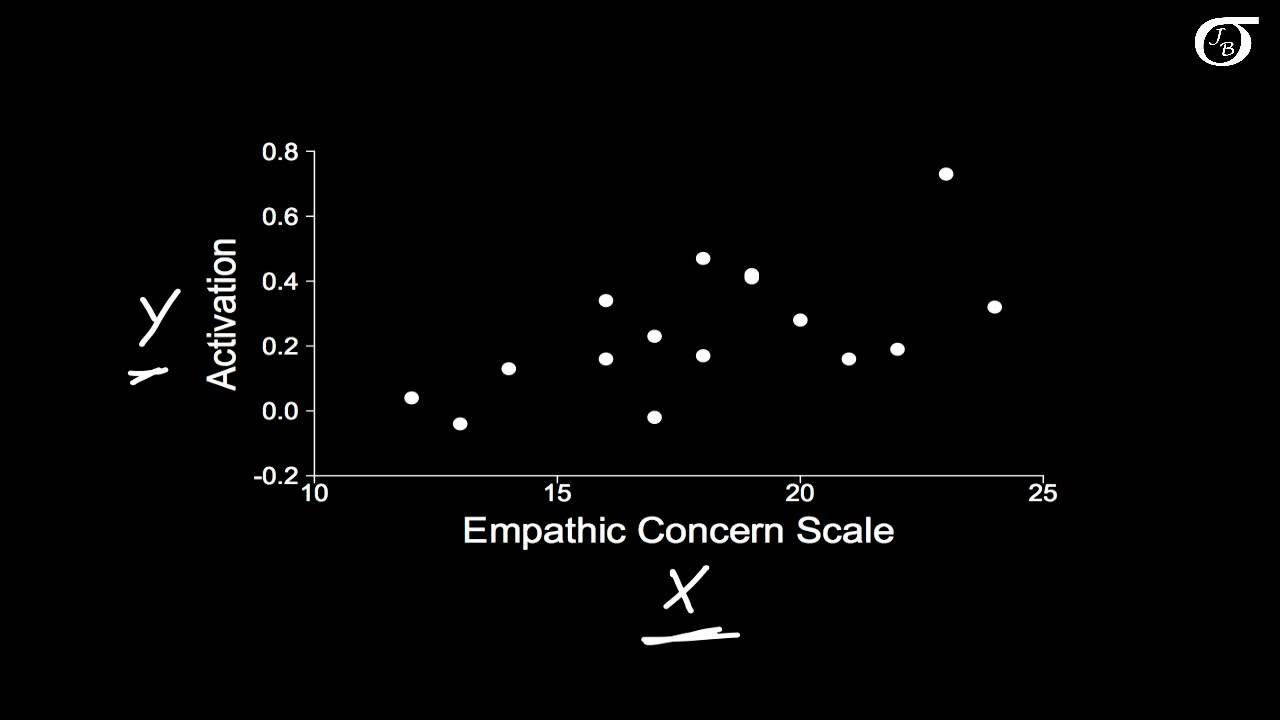
- 😀 Visualization of data is important to understand relationships between variables, such as the correlation between TV ad spend and sales.
- 😀 For data visualization, Seaborn is used to create plots that help identify patterns and correlations in the dataset.
- 😀 Linear regression is used for making predictions. The model connects input variables (such as TV, Radio, and Newspaper spend) to the predicted output (sales).
- 😀 The coefficients in a linear regression model indicate the impact of each input variable on the predicted outcome. For example, increasing TV ad spend by $1000 can increase sales by a certain amount.
- 😀 The lecture explains how to split the data into training and testing sets, and then use the training data to build a regression model.
- 😀 The output of a linear regression model includes an intercept and coefficients for each input variable, which help in making predictions and understanding relationships.
- 😀 The accuracy of the regression model's predictions is evaluated using performance metrics, which will be covered in the next lecture.
Q & A
What is the primary focus of the lecture discussed in the script?
-The primary focus of the lecture is on predicting regression tasks, specifically how to predict continuous values using machine learning, particularly linear regression.
What is the difference between regression and classification tasks in machine learning?
-Regression tasks predict continuous values, such as numeric data with decimals, whereas classification tasks predict categorical outcomes, such as 'yes' or 'no'.
What does the script explain about the dataset used for this regression task?
-The dataset contains advertisements' costs in TV, radio, and newspaper media, with the response variable being product sales. The goal is to predict sales based on the advertising expenses.
How does the script suggest visualizing data for regression analysis?
-The script suggests using the Seaborn library to visualize data, with scatter plots showing the relationship between advertising costs (TV, radio, and newspaper) and sales.
What are the advantages and disadvantages of using linear regression as explained in the script?
-The advantages of linear regression include its speed, ease of interpretation, and no need for hyperparameter optimization. The disadvantages are that it may not always produce the most accurate predictions and is primarily useful for initial hypothesis testing.
What does the script mention about the interpretation of coefficients in linear regression?
-The coefficients in linear regression represent the effect of each variable on the predicted outcome. For example, an increase in TV advertisement spending results in a specific increase in sales, and the script provides examples of such relationships for TV, radio, and newspaper ads.
How does the script explain the process of reading and handling data using Pandas?
-The script demonstrates how to use the Pandas library to read a dataset (like 'Advertising') and inspect its first and last few rows. It also mentions checking the shape of the dataset and identifying the features and response variable.
What is the purpose of splitting the dataset into training and test sets?
-The dataset is split into training and test sets to allow the model to learn from the training data and evaluate its performance on unseen test data, ensuring better generalization.
How is the linear regression model built and evaluated in the script?
-The script demonstrates building the model using the scikit-learn library, fitting it to the training data, and then inspecting the model's intercept and coefficients. The model is used to make predictions, and evaluation is done based on these predictions (though model evaluation metrics are to be discussed in the next meeting).
What does the script highlight about the relationship between advertising spending and sales?
-The script highlights that increasing spending on TV advertisements generally increases sales, while radio advertisements show a less consistent correlation. Newspaper spending also shows an effect, but it is less pronounced compared to TV.
Outlines

Cette section est réservée aux utilisateurs payants. Améliorez votre compte pour accéder à cette section.
Améliorer maintenantMindmap

Cette section est réservée aux utilisateurs payants. Améliorez votre compte pour accéder à cette section.
Améliorer maintenantKeywords

Cette section est réservée aux utilisateurs payants. Améliorez votre compte pour accéder à cette section.
Améliorer maintenantHighlights

Cette section est réservée aux utilisateurs payants. Améliorez votre compte pour accéder à cette section.
Améliorer maintenantTranscripts

Cette section est réservée aux utilisateurs payants. Améliorez votre compte pour accéder à cette section.
Améliorer maintenantVoir Plus de Vidéos Connexes
Regression Intro - Practical Machine Learning Tutorial with Python p.2

#4 Machine Learning Specialization [Course 1, Week 1, Lesson 2]
Introduction to Simple Linear Regression

WILL THEY LEAVE ME ON READ!? Logistic Regression Predicts the Outcome

ML.NP1.1 Diabetes Prediction Part - 1

Lec-5: Logistic Regression with Simplest & Easiest Example | Machine Learning
5.0 / 5 (0 votes)
