Cara Menentukan Sistem Pertidaksamaan dari Grafik Daerah Penyelesaian
Summary
TLDRThis video tutorial explains how to determine the system of inequalities from a graphical representation of solution regions. It covers key steps such as identifying intercepts on the x and y axes, analyzing the region on either side of the line, and forming the corresponding inequalities. Viewers learn how to translate these graphical insights into mathematical inequalities, using both slope and intercept information, and combine them to create a system. This process helps in visualizing and understanding solution sets for linear inequalities in a straightforward manner.
Takeaways
- 😀 The video explains how to determine a system of inequalities from a given solution region graph.
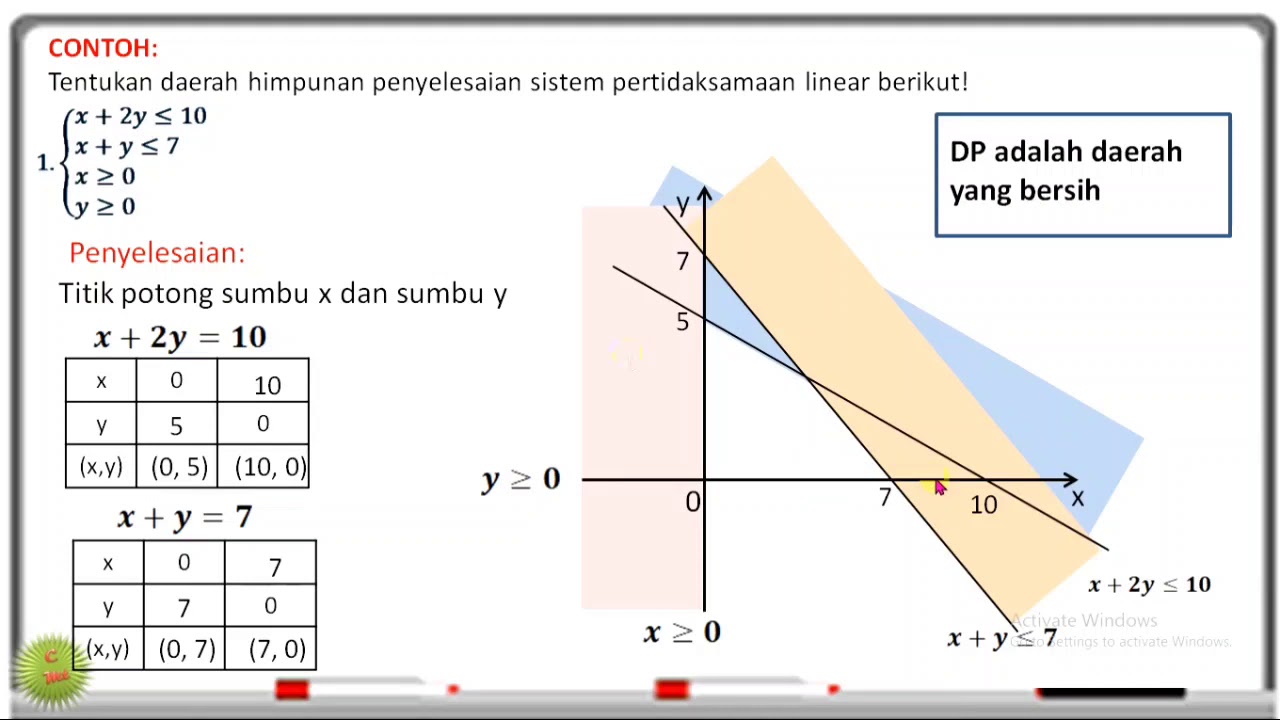
- 😀 Step 1: Identify where the graph intersects the Y-axis and X-axis. The points of intersection are used to form the inequalities.
- 😀 The first inequality is formed by the first line, using the Y-intercept (6) and X-intercept (5). The direction of the inequality depends on which side of the graph the region lies on.
- 😀 For the first inequality, since the region lies to the left of the line, the inequality will be less than or equal to (≤).
- 😀 Multiply the Y-intercept (6) by the X-intercept (5) to simplify the expression to obtain the inequality.
- 😀 The second inequality is formed using the second line, where the Y-intercept is 4 and the X-intercept is calculated based on the graph.
- 😀 The second inequality uses a similar approach, noting whether the region lies to the left or right of the line.
- 😀 The region for the second inequality is on the left of the line, so the inequality will also be less than or equal to (≤).
- 😀 Simplifying the inequality for the second line involves multiplying values and reducing the expression, resulting in a simpler form.
- 😀 After determining the inequalities for each line, the next step is to check the region's location in the coordinate plane. In this case, the region is in quadrant 1, which leads to positive values for both X and Y.
- 😀 The final system of inequalities involves conditions for X and Y being greater than or equal to zero, which corresponds to the region in quadrant 1.
Q & A
What is the first step in determining the system of inequalities from a graph?
-The first step is to identify the lines or boundaries in the graph, as each represents an inequality. For example, the first line corresponds to the first inequality, and the second line to the second inequality.
How do you determine the y-intercept from the graph?
-To determine the y-intercept, observe where the line intersects the y-axis. This point gives you the value of y in the inequality. For example, if the line touches the y-axis at 6, the inequality will have 'y ≤ 6'.
How do you determine the x-intercept from the graph?
-To determine the x-intercept, observe where the line intersects the x-axis. This point gives you the value of x in the inequality. For example, if the line touches the x-axis at 5, the inequality will include 'x ≤ 5'.
How do you decide whether to use a 'greater than or equal to' or 'less than or equal to' inequality?
-The direction of the inequality depends on the region of the graph. If the solution region is above the line, use 'greater than or equal to' (≥). If the solution region is below the line, use 'less than or equal to' (≤).
What should you do if the solution region lies on the left side of the graph?
-If the solution region is on the left side of the graph, the inequality for the x-axis will be 'x ≤ 0', indicating that x is less than or equal to zero.
How do you write the inequality for the second line in the graph?
-To write the inequality for the second line, identify where the line intersects the y-axis and x-axis, and determine the region. For example, if the y-intercept is 4 and the x-intercept is 8, and the region is below the line, the inequality will be 'y ≤ 4' and 'x ≤ 8'.
What happens when you need to simplify the inequality expressions?
-You simplify inequality expressions by multiplying or dividing both sides of the inequality by constants. For example, if the inequality involves a term like 6x ≤ 30, you can divide both sides by 6 to simplify it to 'x ≤ 5'.
What is the significance of the solution region being in the first quadrant of the graph?
-When the solution region lies in the first quadrant (where both x and y are positive), the inequalities for x and y will be 'x ≥ 0' and 'y ≥ 0', indicating that both variables must be non-negative.
How do you combine multiple inequalities from the graph into one system?
-You combine the inequalities by writing each inequality derived from the boundaries of the solution region. For example, if you have inequalities like 'y ≤ 6', 'x ≤ 5', 'x ≥ 0', and 'y ≥ 0', you would combine them into a system of inequalities.
Can the process of determining inequalities from a graph be simplified?
-Yes, the process can be simplified by focusing on the intercepts, determining the direction of the inequality based on the region, and simplifying the expressions algebraically. However, practice is essential to quickly interpret the graph and write the correct inequalities.
Outlines

Cette section est réservée aux utilisateurs payants. Améliorez votre compte pour accéder à cette section.
Améliorer maintenantMindmap

Cette section est réservée aux utilisateurs payants. Améliorez votre compte pour accéder à cette section.
Améliorer maintenantKeywords

Cette section est réservée aux utilisateurs payants. Améliorez votre compte pour accéder à cette section.
Améliorer maintenantHighlights

Cette section est réservée aux utilisateurs payants. Améliorez votre compte pour accéder à cette section.
Améliorer maintenantTranscripts

Cette section est réservée aux utilisateurs payants. Améliorez votre compte pour accéder à cette section.
Améliorer maintenantVoir Plus de Vidéos Connexes

Sistem Pertidaksamaan Linear Dua Variabel | Pengetahuan Kuantitatif | Alternatifa
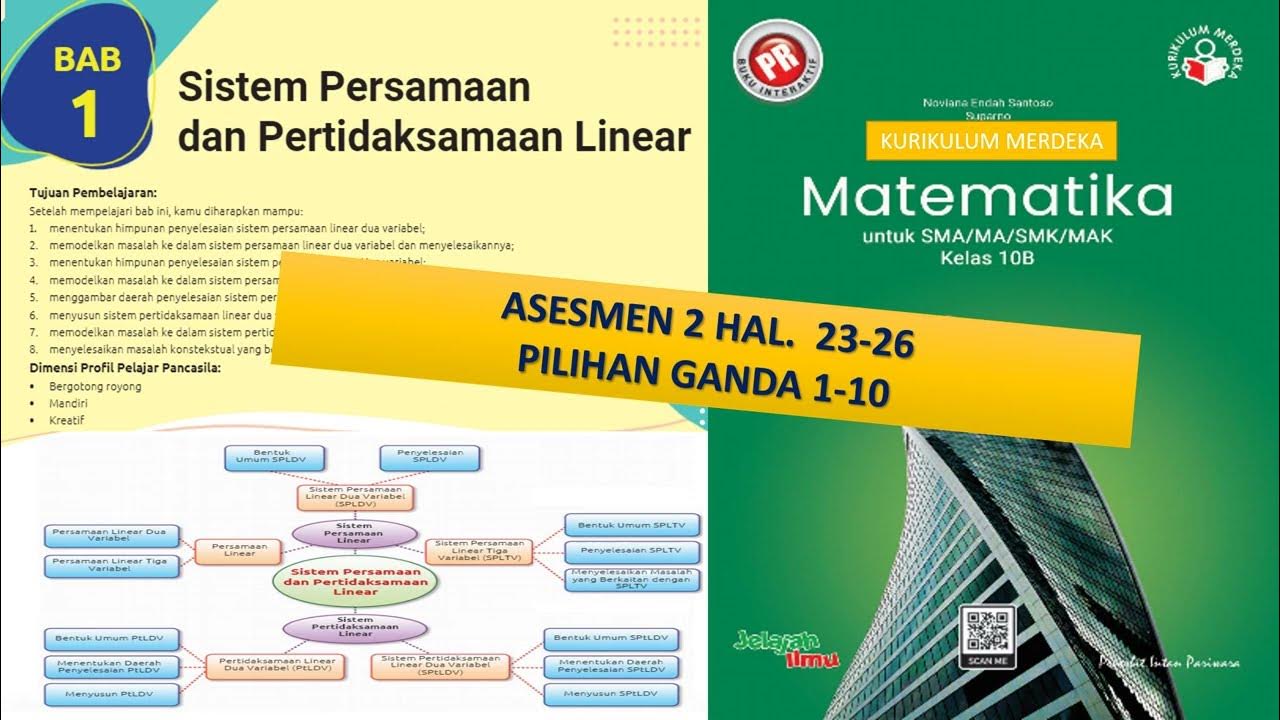
Pembahasan Buku PR Matematika Kelas XB Intan Pariwara|Asesmen 2 Pilihan Ganda No.1-10|Kurmer
SPtLDV (Sistem Pertidaksamaan Linear Dua Variabel) Kelas 10 Kurikulum Merdeka
SISTEM PERTIDAKSAMAAN LINEAR DUA VARIABEL SPtLDV

ILLUSTRATING LINEAR INEQUALITIES IN TWO VARIABLES || GRADE 8 MATHEMATICS Q2

Solving Quadratic Inequalities
5.0 / 5 (0 votes)
