¿Qué es la INTEGRAL? | SIGNIFICADO de la integral definida (Lo que no te enseñan sobre la integral)
Summary
TLDRThis educational video script delves into the practical significance of integrals in calculus, illustrating the concept through the analogy of a car's journey. It explains how integrals can calculate the distance traveled under various speed conditions, transforming abstract mathematical operations into tangible applications. The script further explores the concept of definite integrals, demonstrating their use in approximating areas under curves, which can represent anything from distances to energy accumulation over time. The goal is to demystify calculus and highlight its beauty and utility in real-world scenarios.
Takeaways
- 📚 Calculus integrals are often misunderstood, with a focus on calculation rather than understanding their real-world applications.
- 📉 The integral of a function can represent the area under the curve, which in some contexts, like motion, equates to the distance traveled.
- 🚗 A constant speed of 20 km/h over 8 hours results in a distance of 160 kilometers, illustrating the direct relationship between speed, time, and distance.
- 📈 The graph of speed versus time can visually represent the distance traveled, with the area under the curve corresponding to that distance in kilometers.
- 🔄 When speed varies, the integral of the speed function over time can still represent the total distance traveled, even if the speed changes throughout the trip.
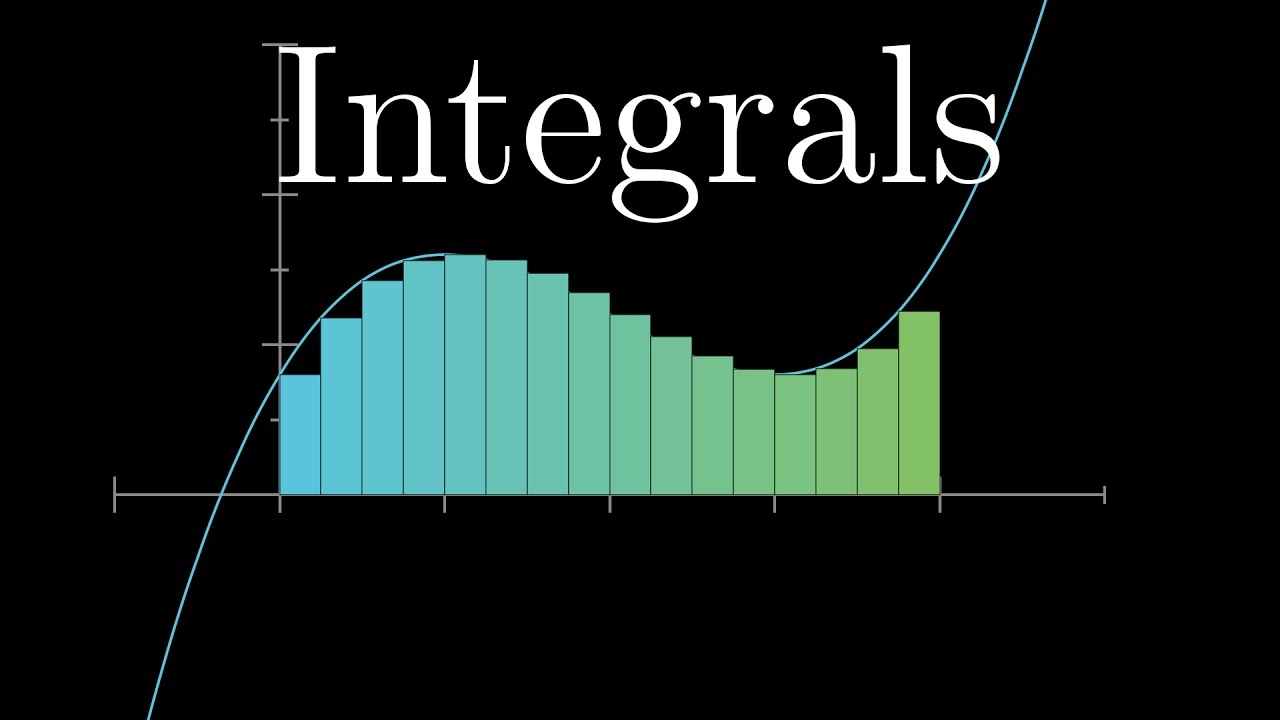
- 🔶 The concept of dividing the area under a curve into simpler shapes like rectangles and trapezoids helps in calculating the total distance when speed is not constant.
- 📝 The integral of a velocity function over time gives the total distance traveled, regardless of whether the speed is constant or changes over time.
- 📊 The approximation of the area under a curve can be improved by using thinner rectangles, leading to a more accurate representation of the actual area.
- ∫ The definite integral is a mathematical tool used to find the exact area under a curve, representing the accumulation of a quantity over a given interval.
- 🌐 The meaning of the area under a curve (integral) depends on the context of the function being integrated, such as distance in motion or energy in a system.
- 🎓 Understanding the concepts behind calculus, such as integrals, can make learning more enjoyable and meaningful by connecting abstract math to tangible applications.
Q & A
What is the primary focus of the video script?
-The video script primarily focuses on explaining the concept of integrals in calculus, emphasizing their practical applications rather than just the computational aspect.
Why does the script suggest we often overlook the true meaning of integrals?
-The script suggests that we often overlook the true meaning of integrals because we tend to focus too much on calculations without considering their practical implications or the real-world problems they can solve.
What is the common misconception about integrals mentioned in the script?
-The common misconception mentioned in the script is that finding the integral of a function is simply about finding the area under the curve of that function, without understanding the deeper meaning behind it.
How does the script use the example of a car trip to explain integrals?
-The script uses the example of a car trip with constant speed to illustrate how the integral can represent the distance traveled, by calculating the area under the speed-time graph.
What is the significance of the speed-time graph in the context of the script?
-The speed-time graph is significant in the script as it visually represents how the integral of speed with respect to time gives the distance traveled, with the area under the graph representing this distance.
How does the script handle the situation where the car's speed is not constant?
-The script handles non-constant speed by dividing the speed-time graph into different sections, such as rectangles and trapezoids, and calculating the area under each to find the total distance traveled.
What is the method described in the script for calculating the distance when the speed changes at every moment?
-The method described is to approximate the area under the curve by summing the areas of rectangles with the same width, and then improving the approximation by making the rectangles thinner (increasing the number of rectangles).
What is the mathematical concept used to represent the limit of the approximation as the width of the rectangles approaches zero?
-The mathematical concept used is the definite integral, denoted by an elongated 'S', which represents the sum of an infinite number of infinitely thin rectangles.
How does the script connect the concept of integrals to real-world applications?
-The script connects integrals to real-world applications by demonstrating how they can be used to calculate distance traveled, energy expended, and other quantities that are the accumulation of rates over time.
What is the script's intention regarding the teaching of calculus?
-The script's intention is to encourage a deeper understanding of calculus concepts, particularly integrals, by explaining them intuitively and relating them to real-world situations, making the subject more approachable and meaningful.
How can viewers support the project presented in the script?
-Viewers can support the project by subscribing to the channel, activating the bell to receive notifications, liking the video, and sharing it with others.
Outlines
📚 Understanding Integrals in Calculus
This paragraph introduces the integral as a fundamental concept in calculus, often misunderstood as merely a calculation tool. It emphasizes the importance of understanding the meaning behind integrals, using the analogy of calculating the area under the curve of a speed-time graph to represent distance traveled. The explanation includes a constant speed scenario and a variable speed scenario, demonstrating how the integral can be visualized as the sum of areas of geometric shapes, leading to the concept of calculating the distance covered when speed varies over time.
🚗 Calculating Distance with Variable Speed
The second paragraph delves into a more complex scenario where speed is not constant, using the example of a car trip with varying speeds. It explains how to calculate the total distance traveled by breaking down the speed-time graph into recognizable geometric shapes (rectangles and a trapezoid) and summing their areas. The paragraph illustrates the process of approximating the area under a curve by dividing it into smaller rectangles, highlighting the method's effectiveness and accuracy as the rectangles become thinner, leading to the concept of a definite integral.
📉 The Definite Integral and Its Applications
The final paragraph explains the concept of the definite integral, using the example of a car's acceleration and deceleration over time to calculate the total distance traveled. It describes the process of approximating the area under a velocity-time graph by summing the areas of infinitely thin rectangles, leading to the exact area under the curve. The paragraph further explores the broader applications of integrals, such as calculating energy when the function represents power over time, emphasizing the integral's significance in various real-world contexts and encouraging a deeper understanding of calculus.
Mindmap
Keywords
💡Integral
💡Calculus
💡Area under the curve
💡Constant speed
💡Graph
💡Distance traveled
💡Variable speed
💡Trapezoid
💡Rectangle
💡Approximation
💡Definite integral
💡Energy
Highlights
Calculus integrals are often misunderstood, focusing on calculation rather than their practical applications.
Integrals can represent the area under a curve, which has practical significance beyond mere computation.
A constant speed of 20 km/h for 8 hours results in a 160 km distance traveled, illustrating basic integral concepts.
Graphical representation of speed versus time can visualize distance traveled as an area under the curve.
The area under the speed-time graph, with units of hours and km/h, corresponds to distance in kilometers.
For non-constant speeds, the integral can be approximated by summing areas of geometric shapes like rectangles and trapezoids.
The integral of a function can be understood as the sum of areas under the curve, approximating with thinner rectangles for better accuracy.
The definite integral represents the exact area under a curve as the width of rectangles approaches zero.
The integral of velocity with respect to time gives the distance traveled, showcasing a real-world application of integrals.
The meaning of an integral depends on the function being integrated, such as speed for distance or power for energy.
Power as a function of time, when integrated, provides the total energy expended over a time interval.
The integral's geometric interpretation is the area under the graph of a function, which can have various physical meanings.
The process of approximating the area under a curve by summing rectangles illustrates the fundamental concept of integration.
The video aims to provide an intuitive understanding of calculus, making it more enjoyable and meaningful for learners.
The importance of understanding the 'why' behind mathematical operations is emphasized for deeper learning.
The video encourages subscribing and engaging with the content for more intuitive explanations of calculus concepts.
Transcripts
When we learn calculus, one of the most relevant topics is the integral. In fact, we spend a large
part of our time calculating integrals of different functions, many times without
really understanding what they mean or how useful they are. We focus too much on calculations
and do not take into account what does it mean that is what we are doing maybe you have been taught
that finding the integral of a function means finding the area under the curve of that function
but what does the area under the curve mean or why so much effort in learning to calculate the area under
the curves of different types of functions because in this video you will learn why it is important
and
imagine that one day you go to your car to make a small trip let's also suppose
that you are going to start your trip with a constant speed of 20 kilometers per hour and it will take
8 hours to reach your destination as you could know the distance traveled by your car from the
speed at which you were traveling since we travel with a constant speed of 20
kilometers per hour this means that every hour our car has traveled a total of
20 kilometers therefore if we want to know how much distance we have traveled we only have
to multiply the speed at which we are going by the time in our case 20 kilometers
per hour multiplied by 8 hours which gives us 160 kilometers therefore the distance
we have traveled in the course of 8 hours has been 160 kilometers
now let's analyze the situation from another perspective let's observe how is the graph
of speed versus time the horizontal axis will represent the time measured in units of hours
and the vertical axis represents the speed measured in units of kilometers per hour
let us also remember that our car traveled with a constant speed of 20 kilometers per
hour for 8 hours and that the distance traveled it was 160 kilometers we can
visualize this distance traveled as an area and if I agree with you you can It may seem
strange to you, but keep in mind that in this graph the horizontal axis has units of hours and the
vertical axis has units of kilometers per hour, so the units of the area correspond to kilometers
, so graphically we can also see that the distance traveled was 160 kilometers but
now we are visualizing it as the area below the graph let's see another situation this time it
will start its trip with your car with a constant speed of 10 kilometers per hour during the
first two hours then it increases its speed until it reaches 40 kilometers per hour over the
course of the next 2 hours and finally you maintain that speed of 40 kilometers per hour
constantly for the next 4 hours making a total travel time of 8 hours
but now your speed has not been constant during the trip but had slight changes
very good now let's look at the graph of speed versus time let's remember that
we travel with a constant speed during before the first two hours in the following two hours
our speed increased from 10 kilometers per hour to 40 kilometers per hour and we maintained
that constant speed for 4 hours plus how much distance we covered in total in this
case well if we make an analogy with the first case yes we want to know the distance traveled
it will suffice to calculate the area under the graph of the function now at first glance the graph does not seem to
be any known geometric figure but there is no problem because we can divide it into three
different areas the area of a rectangle the area of a trapezoid and the area of another rectangle then
if we want to calculate the total area we will simply have to add each of these areas very
well remember that the units of this area were kilometers because remember that the area
gave us the distance traveled so we calculated the distance traveled In each path, the area
of the first rectangle is equal to 20, which means that in this path, ió 20 kilometers then
we have a trapezoid the area of this trapezoid is 50 50 kilometers means that in this journey
a distance of 50 kilometers was traveled and the area of the large rectangle is 160 means that
in this journey we traveled 160 kilometers the total area would be the sum of each of
these areas, so we add 20 plus 50 plus 160, which gives us 230, the total area is 230 kilometers
, that means that the distance covered during the 8 hours was 230 kilometers,
but a more real situation is when the speed changes at all times
let's imagine that now our speed is in meters per second and we start from
rest we accelerate at first and then decelerate moss until we come to a complete stop
in a total of seven seconds how can we know the distance traveled in this case
what What complicates our situation now is that the speed is no longer constant the
speed is changing every moment let's imagine that we can take note of the
speed on our speedometer every second and graph this speed as a function of
time perhaps we find a function that shows how our speed changes as a
function of time for example suppose this function is seven times t minus
t squared measured in meters per second where t will represent the elapsed time
the main question we want to answer is how to find the distance traveled knowing
our speed and in the previous cases that we analyzed we saw that this distance traveled can
be visualized as the area under the graph of the function and the horizontal axis but as we find
the area of this graph it does not look like any known area of a square of a rectangle or
of some other known figure how can we calculate the area of this curve let's see how
for example if we have a rectangle we know well how to calculate the area of a rectangle is
simply multiplying the base times the height now what does this have to do with n find the area
under this curve very well the idea is simple and great at the same time we will do the following we are going to
build rectangles of the same width inside the graph and then we add the areas of these
rectangles and we will obtain an approximation of the real area of the graph is ok i know it is
just an approximation but we can improve this approximation by doing the following if
we take thinner rectangles with a smaller width we will get better approximations
to the real value of the area a creative way to solve a difficult problem that we did not know
how solve by turning it into many simple problems that we do know how to solve let's look at this
process in more detail first let's cut the time axis between 0 and 7 seconds into
smaller intervals of width t equal to 0.5 seconds now let's consider one of those small intervals
for example we can take into account the interval that is between one second and 1.5 seconds in this
small interval the ve speed has changed from six meters per second to 8.2 meters per second
which you can get if you plug these time values into the function that describes the
speed in this interval we are assuming that the speed was constant in the background we know it
is not but it turns out easier to assume that if in this way we can find the distance
traveled in that small interval the area of that rectangle we simply multiply its base
by its height that is 6 meters per second by 0.5 seconds and we obtain 3 meters that means that
in this small interval of time our car has traveled 3 meters this same procedure
we have to do with each of the rectangles obtained inside the graph
each of them will give us the distance traveled in that small interval and since we want to know
the distance traveled between 0 and 7 seconds we will simply have to add each of those
small distances and although obviously this distance traveled only would be an approximation
to the real distance we know that if we take increasingly thinner rectangles we are going to
get a better approximation of the distance very well and now we are going to write an expression to
be able to calculate the approximate area under the curve of the function we know that the area of a rectangle is
calculated by multiplying the base by the height for each rectangle the base is t the
time interval we chose at the beginning and the height will be b which depends on t we have to find the area of
each of these rectangles and then add up all those areas but to get the real value of the
area we have to take rectangles that are thinner each time but how thin infinitely
thin in mathematical terms we have to make te tend to zero that is infinitely
small so we get the real value of the area under the curve of that function now we are going to change
the symbol of the sum for a kind of elongated s s of sum but this is a special sum
precisely e when t tends to zero when we make the rectangles thinner and thinner
because by adding the areas we will have the real value of the area under the curve this sum of the area of
infinite rectangles goes from 0 to 7 and this is the famous called definite integral in in this case
we have the integral of the velocity that depends on time and in this case that area represents
the distance traveled by our car so what is the meaning of a definite integral
and the answer is it depends on the function that you are integrating geometrically the integral
of a function between two points the area under the graph of that function now yes that function
that you integrate is the speed and this speed depends on time then the integral will give you
the distance traveled in that time interval in the same way as we analyzed the
previous examples so the meaning of that area under the curve depends on what your function represents,
for example let's imagine that we have a function that represents Consider the power developed by a
system and that this power is also a function that depends on time, so the
integral of that function between that interval will give us the energy in that interval, but why
is power measured in watts and time measured in seconds so when finding the
area the units of this area will be watts per second but since watts is joules over a second
multiplied by second it will give us units of joules which is the unit of energy so
the area under the graph of this function gives us the energy of that system would be
more videos on integral differential calculus focusing on explaining the concepts
intuitively with these videos I want you to really understand what you are doing because this
will allow you to see mathematics in a different way in a more beautiful way it will be for you
much more pleasant to be able to learn them because you will really be understanding what it means
so if you want to see more content of this type you can support my project by subscribing to this
channel by activating the bell so you can not miss the new videos by liking this video
and sharing it with more people thank you very much for your attention and see you in the next video
and
Voir Plus de Vidéos Connexes
Integration and the fundamental theorem of calculus | Chapter 8, Essence of calculus
Calculus - Introduction to Calculus
How to Explain Calculus to a 6th Grader?
Calculus at a Fifth Grade Level
Continuous Annuities | Exam FM | Financial Mathematics Lesson 15 - JK Math
Derivatives: Crash Course Physics #2
5.0 / 5 (0 votes)