Data Modeling Basics | #Tableau Course #32
Summary
TLDRThe video explains the fundamentals of data modeling, a process of organizing and representing data for clear understanding. It covers three types of data models: conceptual, logical, and physical. The speaker focuses on business intelligence data models, specifically the star and snowflake schemas, used in tools like Tableau and Power BI. The star schema, ideal for small datasets, features a central fact table and surrounding dimension tables. The snowflake schema is more complex but optimizes storage. The video uses a star schema to demonstrate its simplicity, with facts and dimensions key to understanding real-world analytics.
Takeaways
- 📊 Data modeling organizes and represents data clearly for decision-making and business performance improvement.
- 🧱 A data model includes entities like customers or products, with attributes like names, and shows relationships between entities.
- 🔍 There are three types of data models: conceptual (big picture), logical (detailed blueprint), and physical (implementation details).
- 📈 Conceptual data models are used for high-level communication with stakeholders, focusing on entities and their relationships.
- 🛠️ Logical data models define structure and constraints, used by designers and developers as blueprints for databases.
- 💾 Physical data models represent the actual implementation of data, with details like data types, keys, and indexes.
- 🌟 Star schema is a simple data model with a central fact table surrounded by dimension tables, commonly used for small to medium datasets.
- ❄️ Snowflake schema is more complex, normalizing dimensions into smaller sub-dimensions, ideal for large datasets to avoid duplication.
- 📦 Dimension tables describe entities like customers or products, while fact tables contain events or transactions, linking dimensions together.
- 🚀 Star schema is crucial in business intelligence (BI) and analytics, frequently used in tools like Tableau or Power BI.
Q & A
What is data modeling?
-Data modeling is the process of organizing and representing data in a clear and understandable way. It defines entities, attributes, and the relationships between entities to help both people and programs understand the data more easily.
What are entities and attributes in a data model?
-Entities are objects or events, such as customers or orders, while attributes are the information related to those entities, like a customer's first and last name.
What are the three types of data models, and how do they differ?
-The three types of data models are: 1) Conceptual data model: a high-level representation to show the big picture, mainly for stakeholders and business analysts. 2) Logical data model: more detailed, defining entity structures and relationships, used by database designers as a blueprint. 3) Physical data model: includes technical details like data types, used by developers to implement the database.
What are fact and dimension tables in a data model?
-Fact tables store events and transactions, such as sales orders, and often include dates and measures like quantities and profits. Dimension tables describe entities, such as customers or products, and contain descriptive information like names or categories.
How do star and snowflake schemas differ?
-In a star schema, there is a central fact table surrounded by dimension tables, forming a star-like shape. In a snowflake schema, the dimensions are further normalized into sub-dimensions, which reduces redundancy but increases complexity.
When should a star schema be used, and when is a snowflake schema more appropriate?
-A star schema is typically used for smaller or medium-sized datasets as it is simple and easy to understand. A snowflake schema is used for larger datasets where normalized tables reduce data duplication and optimize storage.
What key elements are present in fact tables?
-Fact tables typically contain foreign keys that link to dimension tables, dates for tracking events, and numeric measures such as sales, quantities, or profits.
How do you determine if a table is a fact or a dimension table?
-If the table contains information about a physical person or object, like customers or products, it is a dimension table. If the table contains events or transactions with associated dates and measures, it is a fact table.
Why is data modeling important for business intelligence and analytics?
-Data modeling helps organize data in a way that makes it easier to query, analyze, and visualize, which is crucial for making informed business decisions and improving performance.
Does Tableau use all types of data models?
-Tableau adopts both the logical and physical data models in its data sources but does not include conceptual data models.
Outlines

Cette section est réservée aux utilisateurs payants. Améliorez votre compte pour accéder à cette section.
Améliorer maintenantMindmap

Cette section est réservée aux utilisateurs payants. Améliorez votre compte pour accéder à cette section.
Améliorer maintenantKeywords

Cette section est réservée aux utilisateurs payants. Améliorez votre compte pour accéder à cette section.
Améliorer maintenantHighlights

Cette section est réservée aux utilisateurs payants. Améliorez votre compte pour accéder à cette section.
Améliorer maintenantTranscripts

Cette section est réservée aux utilisateurs payants. Améliorez votre compte pour accéder à cette section.
Améliorer maintenantVoir Plus de Vidéos Connexes

Modelagem de Dados Conceitual na prática
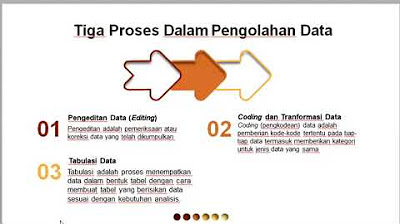
DEFINISI PENGOLAHAN DATA

PENYAJIAN DATA DALAM BENTUK TABEL & DIAGRAM || PENGOLAHAN DATA

Bancos de Dados - Aula 01 - Visão geral sobre banco de dados e motivação
Kurikulum Merdeka Materi Informatika Kelas 7 Bab 6 Analisis Data Bagian 1

Data And Program Representation
5.0 / 5 (0 votes)
