Materi 2 (Part 1) Metode Numerik : Akar Persamaan Tak Linear
Summary
TLDRThis video is the second in a series on amateur numerical methods, focusing on finding the roots of nonlinear equations. The speaker reviews last week's material on numerical methods, highlighting their use when analytical methods fail. They introduce nonlinear equations, explaining them as equations that involve algebraic and transcendental functions, such as exponents and logarithms. The video explores root localization techniques, such as graphical and tabulation methods, for approximating the solutions of these equations. Through examples, the speaker demonstrates how to visualize and approximate the roots of nonlinear equations graphically.
Takeaways
- 📚 The video is the second in a series about numerical methods, focusing on nonlinear equations.
- 🧮 Numerical methods are used when analytical methods are not sufficient to solve mathematical problems.
- 🔢 Linear equations are common, but nonlinear equations, which involve exponents, logarithms, and trigonometry, are also important.
- ⚙️ Nonlinear equations can involve algebra and transcendental functions, making their solutions more complex.
- 🔍 Root-finding in nonlinear equations involves identifying values that make the equation equal to zero, known as 'root localization'.
- 📈 There are two main methods for root localization: graphical methods and tabulation.
- 📊 Graphical methods can include single or double graphs, where points are plotted to estimate where the function crosses zero.
- 🔍 Initial guesses are important for finding the root, based on visualizing where the function might intersect with the x-axis.
- 🧠 The video emphasizes understanding and plotting functions to make educated guesses about where the roots may lie.
- 🔄 Multiple methods, like substitution or elimination, are used to simplify and analyze nonlinear equations step by step.
Q & A
What is the main topic of the second video?
-The main topic of the second video is about amateur numerical methods, specifically focusing on non-linear equations.
What is the difference between numerical and analytical methods?
-Numerical methods are used when analytical methods cannot be applied. Analytical methods usually provide exact solutions to mathematical problems, while numerical methods are used when an exact solution is not feasible.
What are non-linear equations?
-Non-linear equations are equations that are not linear, meaning they cannot be expressed as a polynomial of degree one.
What is meant by 'localization of the root' in the context of solving equations?
-Localization of the root refers to the process of finding an initial guess or an interval where the solution (root) of an equation is likely to be found.
How can one find an initial guess for the root of a non-linear equation?
-One can find an initial guess for the root of a non-linear equation using graphical methods or tabulation by plotting the function and observing where it crosses the x-axis.
What are the two methods mentioned for localization of the root?
-The two methods mentioned for localization of the root are graphical method and tabulation method.
What is the graphical method for finding the root of an equation?
-The graphical method involves plotting the function and visually inspecting where it intersects the x-axis to find the roots.
What does the term 'grafik tunggal' and 'grafik ganda' refer to in the context of the video?
-In the context of the video, 'grafik tunggal' refers to a single plot of a function, while 'grafik ganda' refers to a plot that includes two functions to find their intersection points, which could represent the roots of an equation.
Why is it important to find the intersection points of two curves in 'grafik ganda'?
-The intersection points of two curves in 'grafik ganda' are important because they represent the points where the functions have equal values, which can indicate the roots of the equation.
What is the significance of the point where the function value is zero in solving equations?
-A point where the function value is zero is significant because it represents a root of the equation, where the function equals zero.
How does the presenter suggest to find the roots of the equation f(x) = x^(1/3) - x?
-The presenter suggests finding the roots of the equation f(x) = x^(1/3) - x by plotting the function and looking for the points where the curve intersects the x-axis.
Outlines

Cette section est réservée aux utilisateurs payants. Améliorez votre compte pour accéder à cette section.
Améliorer maintenantMindmap

Cette section est réservée aux utilisateurs payants. Améliorez votre compte pour accéder à cette section.
Améliorer maintenantKeywords

Cette section est réservée aux utilisateurs payants. Améliorez votre compte pour accéder à cette section.
Améliorer maintenantHighlights

Cette section est réservée aux utilisateurs payants. Améliorez votre compte pour accéder à cette section.
Améliorer maintenantTranscripts

Cette section est réservée aux utilisateurs payants. Améliorez votre compte pour accéder à cette section.
Améliorer maintenantVoir Plus de Vidéos Connexes
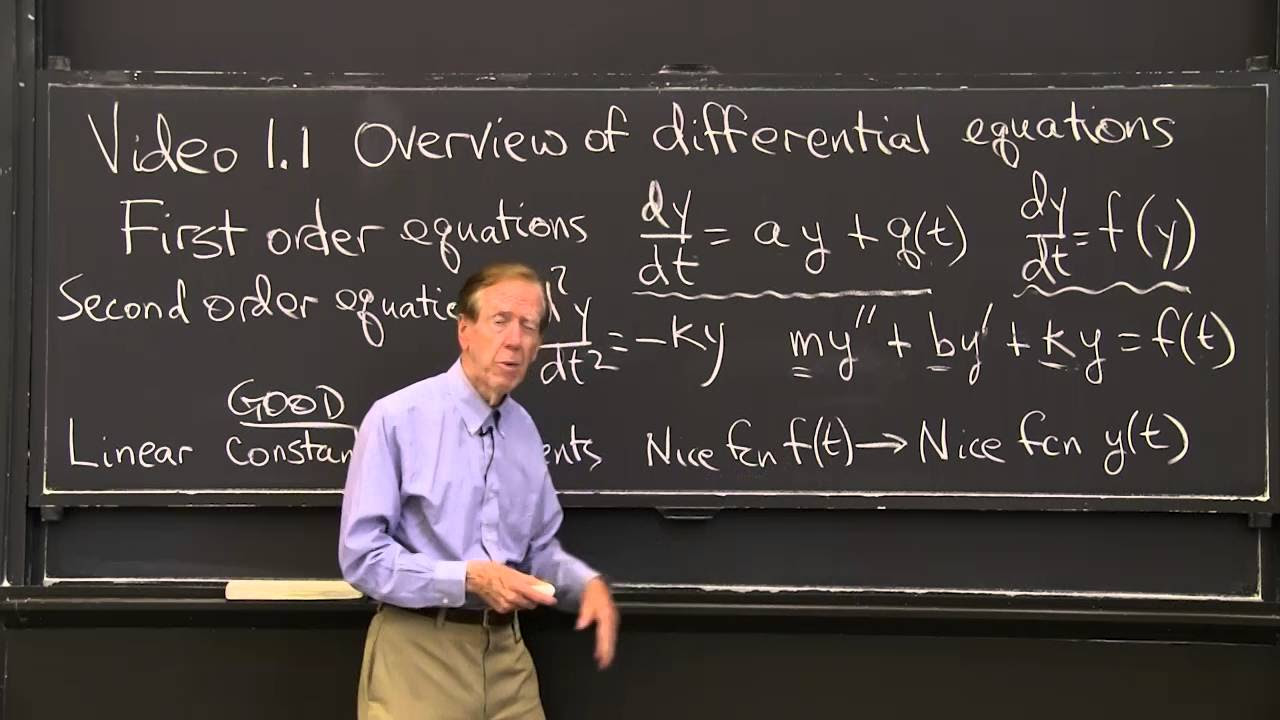
Overview of Differential Equations
S. Y. B. SC. (Comp.Sci.) (Paper - II: Numerical Techniques) Ch1-Algebraic & Transcendental Eq.(Lec1)
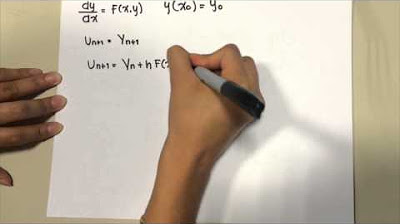
Método de Euler y Euler Mejorado

Video 1 Kuliah Metode Numerik 1 | Pendahuluan Komputasi Saintifik
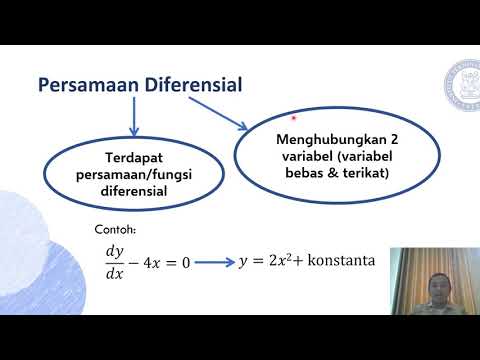
Pengantar Persamaan Diferensial

Fisika Komputasi 1: Metode-metode Akar persamaan Secara Numerik
5.0 / 5 (0 votes)
