How to become a Data Analyst FAST (By 2025)
Summary
TLDRThis video offers a comprehensive roadmap for aspiring data analysts to secure their first role by 2025. It emphasizes the importance of consistent effort, understanding statistics as the language of data, and mastering Excel for data manipulation. The speaker also highlights the necessity of learning SQL for database management and Python or R for scripting. The video suggests practical steps, including joining Discord communities, practicing with real datasets, and building a portfolio to showcase skills. It assures viewers that breaking into the field is achievable with dedication and the right resources, even without a formal degree.
Takeaways
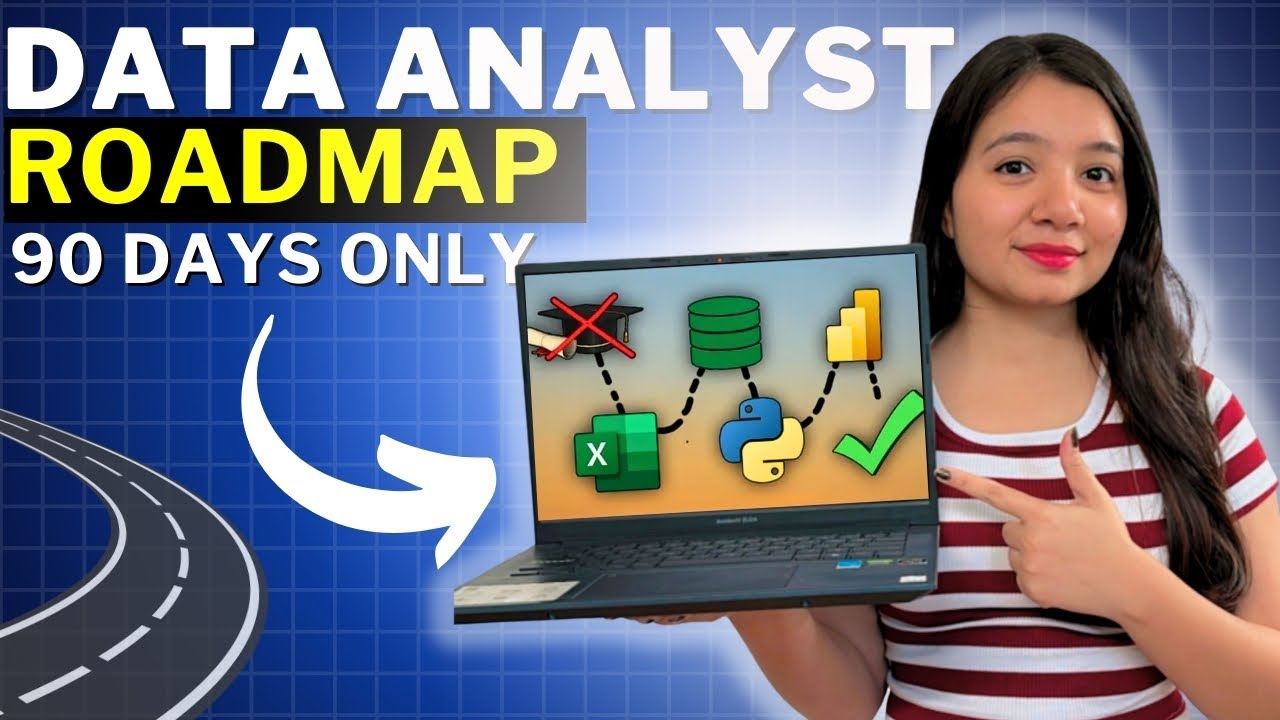
- 😀 The video provides a roadmap to land a data analyst role by 2025, emphasizing the importance of consistency and discipline in learning.
- 🎓 You don't need a relevant degree or extensive experience to break into data analytics; the focus should be on practical skills.
- 🤝 Joining a community like a Discord server can provide valuable networking opportunities and support in learning analytics.
- 📊 Understanding statistics is crucial as it forms the basis for data analysis, including concepts like descriptive statistics, correlation, and probability.
- 📈 Excel and Google Sheets are essential tools for data analysts, with pivot tables, conditional formatting, and visualization being key skills to master.
- 💾 SQL is a must-have skill for data analysts, used for retrieving and manipulating data from relational databases, and it's important to learn its basics and efficiency.
- 🐍 Learning Python or R is beneficial, with Python being more versatile for various fields including data analysis, and key libraries to learn include pandas, numpy, and matplotlib.
- 📊 Visualization tools like Tableau, Looker, or PowerBI are important for presenting data insights effectively, and storytelling with data is a valuable skill.
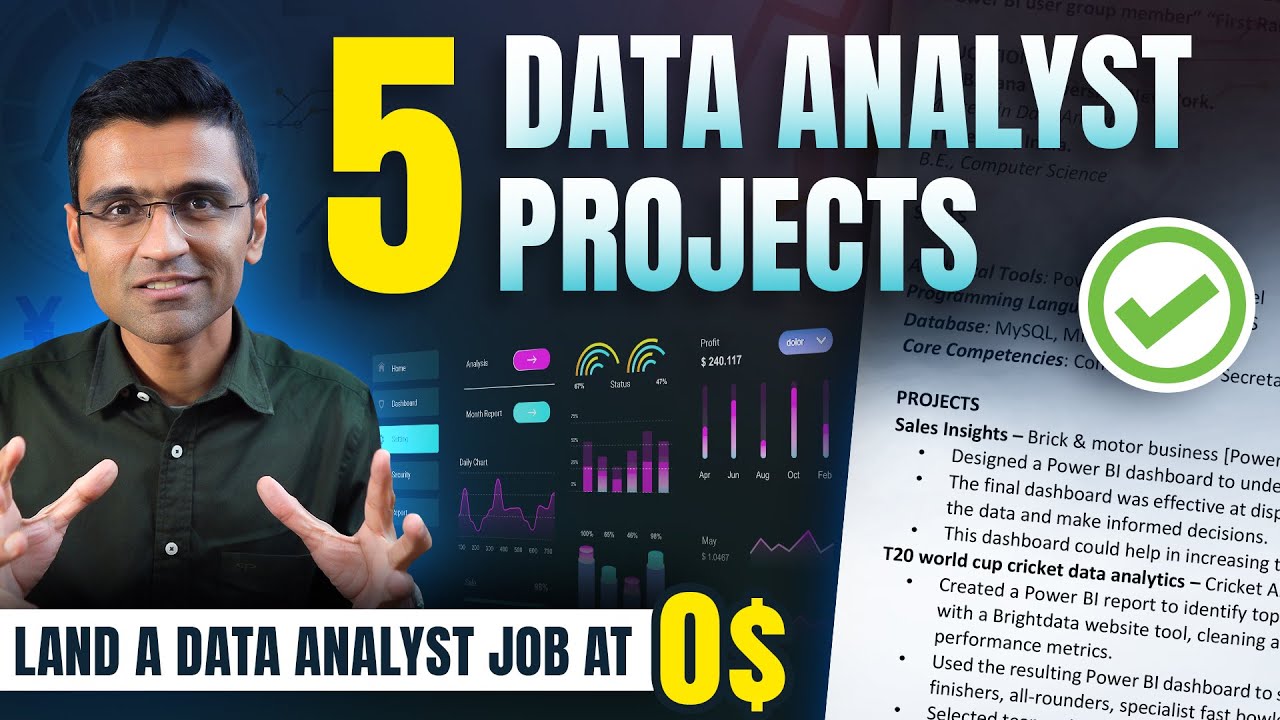
- 💼 Building a portfolio showcasing your data analysis projects can significantly improve your job prospects in the analytics field.
- 🔗 Consistent practice and application of learned skills are necessary for mastering data analysis, and showing your work is more impactful than just stating your abilities.
Q & A
What is the main goal of the video?
-The main goal of the video is to provide a roadmap to help viewers land their first data analyst role before 2025, regardless of their current profession or educational background.
Why is consistency and discipline emphasized in the video?
-Consistency and discipline are emphasized because breaking into the field of data analytics requires daily effort and commitment, rather than relying on quick fixes or shortcuts.
What is the significance of joining a Discord server for beginners in data analytics?
-Joining a Discord server is significant because it offers a community where beginners can receive referrals, collaborate on group projects, and get support from others in the field, which is beneficial for breaking into tech and data science.
Why is having a grasp of statistics important for a data analyst?
-Statistics is important because it is the language of data and analytics. It helps in understanding and interpreting data, conducting analyses, and ensuring that the analysis is not plagued by bias.
What are the basic statistical concepts a data analyst should understand?
-A data analyst should understand descriptive statistics like mean, median, mode, and standard deviation, as well as concepts of correlation, probability, and hypothesis testing.
How can one learn the necessary statistical concepts without a formal degree?
-One can learn the necessary statistical concepts through free online courses on platforms like Coursera, Khan Academy, or by watching educational videos on YouTube.
Why is Excel or Google Sheets a crucial skill for a data analyst?
-Excel or Google Sheets is crucial because it is a ubiquitous tool used across industries for data manipulation, analysis, and visualization, and is often required for day-to-day tasks in data analysis.
What are some key Excel or Google Sheets skills that a data analyst should master?
-Key skills include creating pivot tables for data summarization, using conditional formatting to highlight data patterns, and creating visualizations and dashboards for data presentation.
What is SQL and why is it essential for a data analyst?
-SQL (Structured Query Language) is a tool used to retrieve, manipulate, and analyze data stored in relational databases. It is essential because it allows data analysts to communicate with and extract insights from large datasets.
How can one practice SQL effectively?
-One can practice SQL effectively by using online platforms like W3Schools, Codecademy, or by participating in coding challenges on websites like LeetCode or HackerRank. Additionally, creating databases with multiple tables using tools like SQLite can help practice joins and other SQL queries.
Why is learning Python or R recommended for a data analyst?
-Python or R are recommended because they are scripting languages with powerful libraries for data manipulation, numerical operations, and visualization, which are crucial for advanced data analysis and automation.
What are some important Python libraries for data analysis that the video suggests learning?
-The video suggests learning libraries such as pandas for data manipulation, numpy for numerical operations, matplotlib or seaborn for visualization, and scikit-learn if interested in machine learning.
How can one learn data visualization tools like Tableau?
-One can learn data visualization tools like Tableau through online courses on platforms like Udemy or LinkedIn Learning, by practicing with Tableau Public, or by using free trials of other business intelligence tools.
What is the importance of creating a portfolio in the context of job hunting for data analyst roles?
-Creating a portfolio is important because it showcases practical experience and technical abilities to potential employers, giving job candidates a competitive edge over others who may not have tangible examples of their work.
Outlines

Cette section est réservée aux utilisateurs payants. Améliorez votre compte pour accéder à cette section.
Améliorer maintenantMindmap

Cette section est réservée aux utilisateurs payants. Améliorez votre compte pour accéder à cette section.
Améliorer maintenantKeywords

Cette section est réservée aux utilisateurs payants. Améliorez votre compte pour accéder à cette section.
Améliorer maintenantHighlights

Cette section est réservée aux utilisateurs payants. Améliorez votre compte pour accéder à cette section.
Améliorer maintenantTranscripts

Cette section est réservée aux utilisateurs payants. Améliorez votre compte pour accéder à cette section.
Améliorer maintenantVoir Plus de Vidéos Connexes

Data Analyst Roadmap with Free Resources !!
5 Projects for a Data Analyst Job | All Materials Included

8 In-Demand Data Analytics Skills to Get You Hired
3 Months Data Analyst Roadmap 2024 | Complete Syllabus | Become Job Ready in 3 Months

How to Become a Data Analyst in 2024? (complete roadmap)

Alur Belajar Menjadi Data Analyst 2025 | FREE SUMBER BELAJAR
5.0 / 5 (0 votes)
