Bar Chart, Pie Chart, Frequency Tables | Statistics Tutorial | MarinStatsLectures
Summary
TLDRThis script discusses summarizing categorical variables graphically and numerically. It uses smoking status as an example, with categories like never, past, and current smokers. The script explains creating frequency tables, converting frequencies to proportions or percentages, and emphasizes the importance of distribution. It also covers visual representations like bar charts and pie charts, recommending against 3D pie charts for clarity. The key takeaway is summarizing categorical data by counting occurrences and converting them to proportions or percentages for better understanding.
Takeaways
- 📊 To summarize a categorical variable, count the frequency of individuals in each category and convert these counts into proportions or percentages.
- 🔢 For larger sample sizes, it's more meaningful to report proportions or percentages rather than raw frequencies.
- 📈 A frequency table or distribution is a fundamental way to organize and display the data for categorical variables.
- 📋 The distribution of cases among different categories is a key concept in statistics, often visualized through graphical representations.
- 📊 Bar charts are effective for visualizing the distribution of categorical variables, with the x-axis representing categories and the y-axis representing frequencies, proportions, or percentages.
- 🍕 Pie charts provide another visual representation where each slice of the pie corresponds to a category's proportion of the total sample.
- ⚠️ With smaller sample sizes, reporting frequencies might be more meaningful and easier to interpret than proportions or percentages, which could be misleading.
- 🎨 When creating pie charts, ensure that the slices are proportional to the data they represent; avoid 3D pie charts as they can distort perceptions of size.
- 📝 It's important to label charts clearly, including the percentages or proportions within pie chart slices for better understanding.
- 💡 The choice between using a bar chart or a pie chart depends on the size of the dataset and the clarity required for the intended audience.
Q & A
What are the three methods discussed for summarizing a categorical variable?
-The three methods discussed for summarizing a categorical variable are using a frequency table, converting frequencies into proportions or relative frequencies, and reporting these as percentages.
What is the significance of a frequency table in summarizing categorical data?
-A frequency table is significant as it counts how many individuals fall into each category of the variable, providing a clear distribution of the data across different categories.
Why might proportions or percentages be more meaningful than frequencies with larger sample sizes?
-Proportions or percentages might be more meaningful with larger sample sizes because they provide a relative measure that is independent of the sample size, making it easier to compare distributions across different samples.
What is the difference between a proportion and a percentage in the context of categorical data?
-In the context of categorical data, a proportion is the ratio of the number of observations in a category to the total number of observations, while a percentage is the proportion multiplied by 100 to express the ratio as a part of a whole.
Why is it recommended to avoid 3D pie charts when summarizing categorical data?
-3D pie charts are recommended to be avoided because they can distort the perception of the data's distribution, making some slices appear larger than they actually are, which can mislead the interpretation of the data.
What is the importance of visual representations like bar charts and pie charts in data summary?
-Visual representations like bar charts and pie charts are important because they provide a quick and intuitive way to understand the distribution of data across different categories, making complex data easier to interpret.
How does the choice of visual representation (bar chart or pie chart) affect the perception of data distribution?
-The choice of visual representation can significantly affect the perception of data distribution. Bar charts clearly separate categories and are good for comparing proportions, while pie charts show parts of a whole but can be misleading if not presented in 2D.
What is the recommended approach when dealing with smaller sample sizes in categorical data?
-When dealing with smaller sample sizes, it is recommended to report frequencies instead of proportions or percentages, as they provide a more direct and less potentially misleading representation of the data.
Can you provide an example of how to calculate the proportion for a category from the transcript?
-Yes, for the category 'never smokers' with 110 individuals out of a sample size of 200, the proportion is calculated as 110/200, which equals 0.55.
What is the main principle of producing a plot that 3D pie charts might violate?
-3D pie charts might violate the principle of accurately representing data proportions, as the added depth can distort the visual perception of the size of the slices, leading to a misleading representation of the data.
Outlines

Cette section est réservée aux utilisateurs payants. Améliorez votre compte pour accéder à cette section.
Améliorer maintenantMindmap

Cette section est réservée aux utilisateurs payants. Améliorez votre compte pour accéder à cette section.
Améliorer maintenantKeywords

Cette section est réservée aux utilisateurs payants. Améliorez votre compte pour accéder à cette section.
Améliorer maintenantHighlights

Cette section est réservée aux utilisateurs payants. Améliorez votre compte pour accéder à cette section.
Améliorer maintenantTranscripts

Cette section est réservée aux utilisateurs payants. Améliorez votre compte pour accéder à cette section.
Améliorer maintenantVoir Plus de Vidéos Connexes
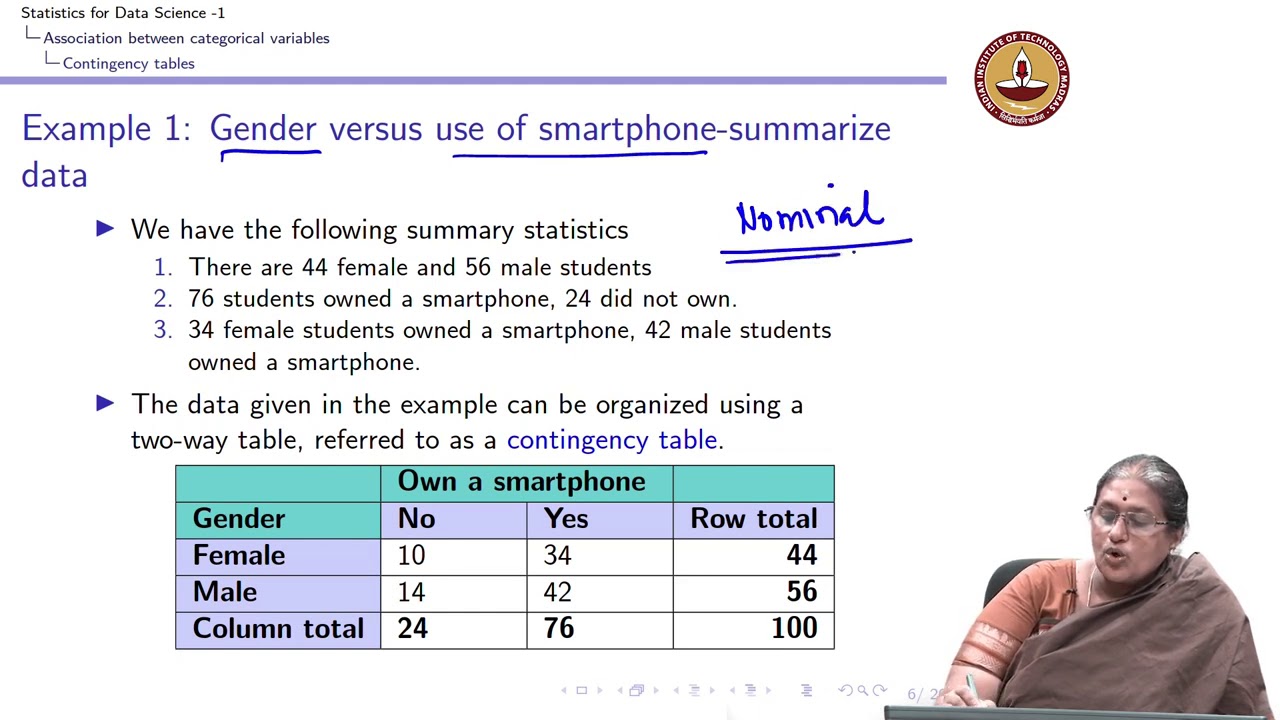
Lecture 4.2 - Association between two categorical variables - Introduction

ANALISIS REGRESI DUMMY VARIABLE
Variables and Types of Variables | Statistics Tutorial | MarinStatsLectures

What is Classification? What is a Classifier?

04. Cómo crear una tabla de contingencia | Curso de SPSS

WRITING RESEARCH TITLE: QUANTITATIVE & QUALITATIVE #ParaMapadaliPagsulatNito #WatchThis #Examples
5.0 / 5 (0 votes)
