04. Cómo crear una tabla de contingencia | Curso de SPSS
Summary
TLDRThis script explains the construction and significance of contingency tables, also known as cross-tabulations, used to analyze the relationship between two categorical variables. It uses the example of smoking habit and lung cancer to demonstrate how these tables can reveal correlations, such as a higher frequency of lung cancer among smokers. The script details the conventional arrangement of variables in the table, with the disease in columns and the risk factor in rows, and discusses the practical approach of building groups from diseased individuals (cases) and non-diseased individuals (controls) for comparative analysis.
Takeaways
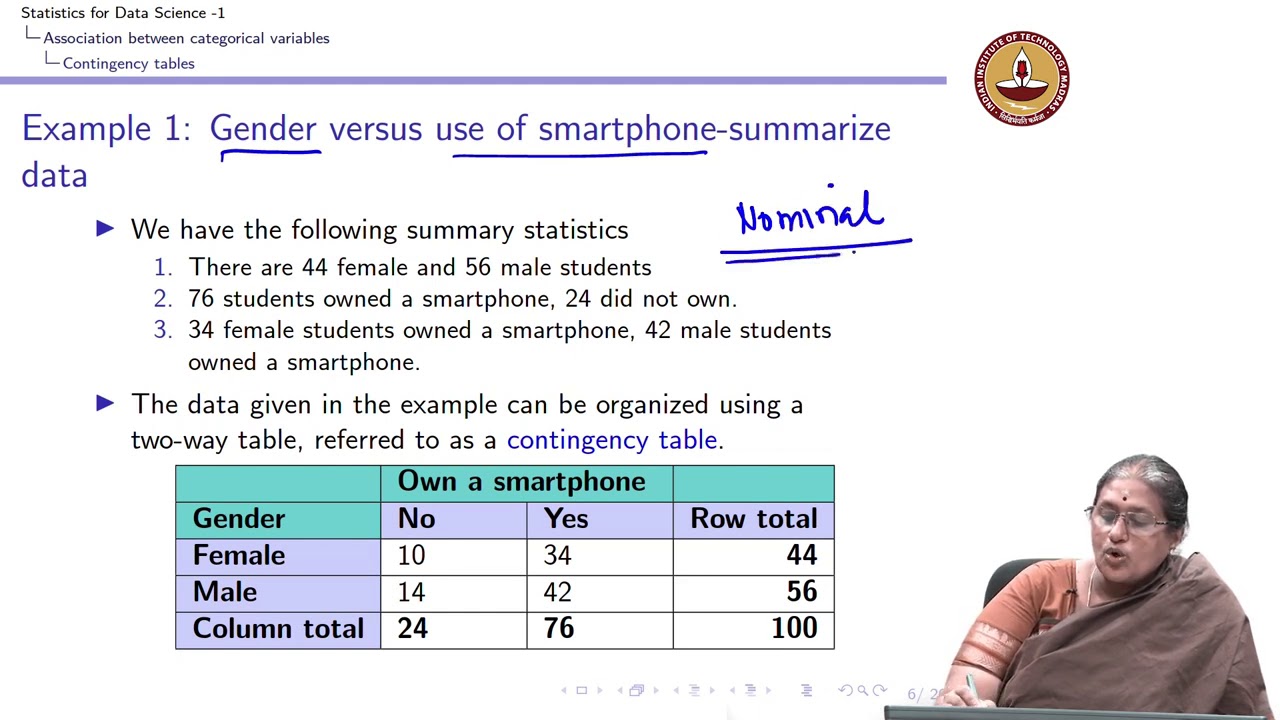
- 📊 Contingency tables, also known as cross-tabulation or double-entry tables, are used to analyze the relationship between two categorical variables.
- 🚬 The example used in the script involves the relationship between smoking habit (a categorical variable) and lung cancer (another categorical variable).
- 🔍 It is suspected that smokers have a higher frequency of lung cancer, and a contingency table is used to demonstrate this relationship.
- 📋 The conventional presentation of a contingency table places the disease or outcome in the columns and the risk factor or independent variable in the rows.
- 🏥 Obtaining a group of people with lung cancer is easier than finding a group of smokers or non-smokers within which to identify cancer cases.
- 📈 The script describes how to calculate percentages for the table cells, with examples showing a higher percentage of smokers among those with lung cancer compared to those without.
- 👥 The groups for analysis are constructed based on the presence of disease, with affected individuals called 'cases' and non-affected individuals 'controls'.
- 🧐 The script emphasizes the ease of finding a control group without lung cancer compared to identifying cancer within groups of smokers or non-smokers.
- 📝 The contingency table is a foundational tool for case-control study designs, where multiple characteristics are compared between affected and non-affected groups to identify potential risk factors.
- ⚖️ The script highlights the importance of proper group selection and comparison in statistical analysis to accurately identify risk factors associated with diseases like lung cancer.
Q & A
What are contingency tables also known as?
-Contingency tables are also known as double-entry tables or cross-tabulation tables.
What is the simplest way to construct a contingency table?
-The simplest way to construct a contingency table is with two categorical variables, where one variable is analyzed and the other is varied according to the level of the investigation.
What is an example of a categorical variable?
-An example of a categorical variable is the habit of smoking, as it categorizes individuals into those who smoke and those who do not.
Why is lung cancer chosen as the second variable in the contingency table example?
-Lung cancer is chosen as the second variable because it is also a categorical variable, and there is a suspicion that it occurs more frequently in smokers than in non-smokers.
What is the conventional order for presenting a contingency table?
-In a contingency table, the disease or consequence is always presented in the columns, and the risk factor or independent variable is presented in the rows.
Why is it easier to find a group of people with lung cancer than a group of smokers?
-It is easier to find a group of people with lung cancer because hospitals can provide a list of such patients, while it is more challenging to find a group of smokers without the disease.
What percentage of the 54 people with lung cancer in the example are smokers?
-In the example, 66.7% of the 54 people with lung cancer are smokers.
What percentage of the 46 people without lung cancer in the example are smokers?
-In the example, 34.8% of the 46 people without lung cancer are smokers.
What is the basis for constructing case-control studies mentioned in the script?
-The basis for constructing case-control studies is to compare affected individuals (cases) with unaffected individuals (controls) on various characteristics that may be more frequent in the affected group.
Why are cases and controls used in the construction of contingency tables?
-Cases and controls are used to identify risk factors by comparing the frequency of certain characteristics in groups with and without the disease.
Outlines

Cette section est réservée aux utilisateurs payants. Améliorez votre compte pour accéder à cette section.
Améliorer maintenantMindmap

Cette section est réservée aux utilisateurs payants. Améliorez votre compte pour accéder à cette section.
Améliorer maintenantKeywords

Cette section est réservée aux utilisateurs payants. Améliorez votre compte pour accéder à cette section.
Améliorer maintenantHighlights

Cette section est réservée aux utilisateurs payants. Améliorez votre compte pour accéder à cette section.
Améliorer maintenantTranscripts

Cette section est réservée aux utilisateurs payants. Améliorez votre compte pour accéder à cette section.
Améliorer maintenantVoir Plus de Vidéos Connexes
Lecture 4.2 - Association between two categorical variables - Introduction

UJI CHI-SQUARE TEORI DAN CONTOH KASUS PART 1
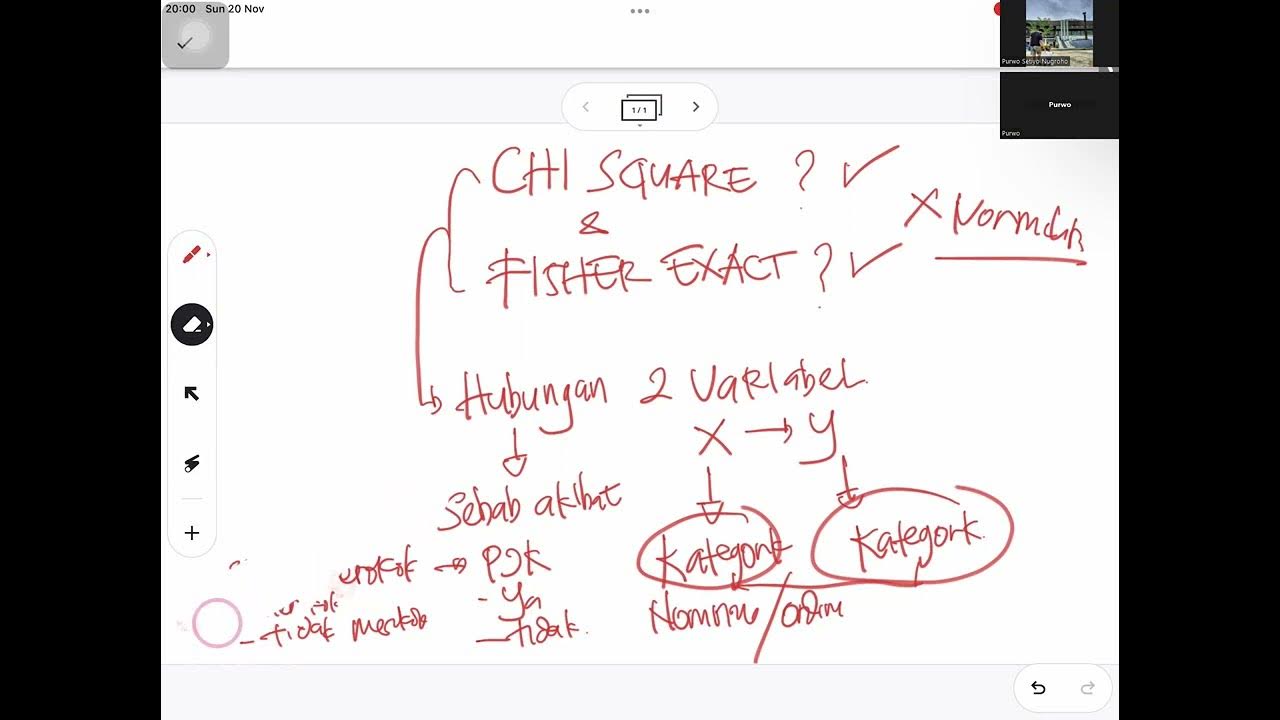
SYARAT MENGGUNAKAN UJI CHI SQUARE DAN FISHER EXACT

How to calculate a Chi-Square Test?

MATERI UJI CHI SQUARE DAN FISHER EXACT (UJI BEDA PROPORSI)

How to Analyze Data with Pivot Tables in Excel
5.0 / 5 (0 votes)
