Lecture 4.2 - Association between two categorical variables - Introduction

IIT Madras - B.S. Degree Programme
21 Oct 202126:03

Summary

TLDRThe script discusses the concept of association between variables, particularly focusing on the relationship between categorical and numerical variables. It explores how to understand and represent these associations through contingency tables, emphasizing the importance of order in ordinal variables. The example of smartphone ownership in relation to gender and income levels illustrates the process of summarizing data and creating cross-tabulations to analyze associations effectively.

Takeaways

  • 📊 The script discusses the concept of association between variables, emphasizing that association does not imply causation.
  • 🔍 It focuses on understanding associations between two numerical variables, particularly in the context of categorical and numerical variables.
  • 📈 The module aims to teach how to interpret the association between two variables using plots and how to create a contingency table to analyze these associations.
  • 👥 A market research example is used to explore whether there is an association between gender and smartphone ownership.
  • 📝 Data is presented in a contingency table format, capturing gender and smartphone ownership among 100 college students.
  • 👩‍🦳‍👦 Gender is captured as a nominal variable with two categories: male and female, while smartphone ownership is a binary categorical variable with 'yes' or 'no'.
  • 🔢 The data summary reveals the count of male and female students, as well as the number who own smartphones and those who do not.
  • 📉 The script explains how to create a pivot table in Google Sheets to analyze the association between gender and smartphone ownership.
  • 📝 The importance of recording data accurately is highlighted, especially when dealing with categorical variables like gender and binary outcomes like smartphone ownership.
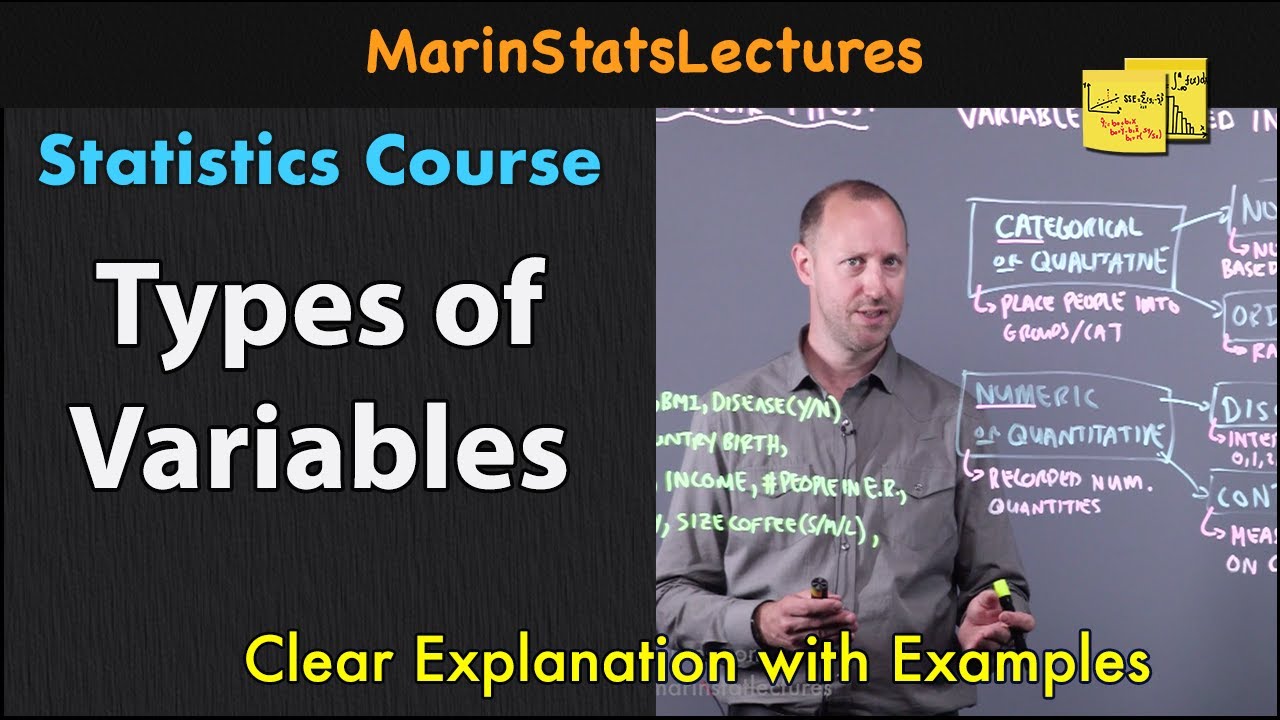
  • 📚 The script also touches on ordinal variables, such as income levels categorized as low, medium, or high, and how they differ from nominal variables.
  • 📋 The final takeaway is about the importance of maintaining the order in the contingency table when dealing with ordinal variables to accurately reflect the data's hierarchy.

Q & A

  • What is the main focus of the module discussed in the script?

    -The main focus of the module is to understand the association between two categorical and numerical variables, specifically how to capture and analyze these associations.

  • What is the significance of understanding the association between variables?

    -Understanding the association between variables is important for identifying patterns, making predictions, and drawing meaningful conclusions from data analysis.

  • What is the purpose of creating a contingency table in the context of this script?

    -The purpose of creating a contingency table is to organize data in a way that makes it easier to analyze the relationship between two categorical variables, such as gender and smartphone ownership.

  • How is the data in the script collected and represented?

    -The data is collected through a survey of 100 college students, capturing information about their gender and whether they own a smartphone, and is represented in a contingency table format.

  • What is the meaning of 'nominal variable' in the context of the script?

    -In the script, a nominal variable refers to a categorical variable that can take on two or more values without any intrinsic order or ranking, such as gender.

  • How is the smartphone ownership variable captured in the script?

    -Smartphone ownership is captured as a binary categorical variable with two values: 'yes' or 'no', indicating whether a student owns a smartphone.

  • What is the term used to describe a table that shows the relationship between two categorical variables?

    -The term used to describe such a table is a 'contingency table', also commonly referred to as a 'cross-tabulation' or 'crosstab'.

  • What is the importance of considering the order in the contingency table when dealing with ordinal variables?

    -When dealing with ordinal variables, considering the order is important because it reflects a ranking or sequence that can influence the analysis and interpretation of the data.

  • How does the script suggest to handle ordinal variables in a contingency table?

    -The script suggests coding ordinal variables with numbers that represent their order, such as 1 for high income, 2 for medium income, and 3 for low income, to maintain the sequence in the contingency table.

  • What is the goal when analyzing the contingency table in the script?

    -The goal is to determine whether there is an association between the categorical variables, such as whether gender is associated with smartphone ownership, and to understand the distribution of these associations across different categories.

  • How can one use the contingency table to explore the relationship between income and smartphone ownership?

    -One can use the contingency table to explore the relationship by comparing the distribution of smartphone ownership across different income levels, thus analyzing if there is a correlation between income and the likelihood of owning a smartphone.

Outlines

00:00

📊 Introduction to Variables Association

This paragraph introduces the concept of understanding the association between two variables, rather than just focusing on a single variable. It emphasizes that association does not imply causation. The speaker discusses the importance of exploring these associations, particularly between categorical and numerical variables, and sets the stage for the module's focus on how to interpret these associations in a dataset.

05:04

🔍 Capturing Gender and Smartphone Ownership

The speaker explains how to capture and analyze data on two categorical variables: gender and smartphone ownership. The data is collected from a survey of 100 students, recording whether they own a smartphone and their gender. The paragraph details how to organize and interpret this data, highlighting the importance of considering both variables to understand potential associations.

10:10

📈 Understanding Categorical Variables

This paragraph delves into the specifics of categorical variables, such as gender and smartphone ownership, explaining that gender is a nominal variable with no inherent order, while smartphone ownership is an ordinal variable with a clear 'yes' or 'no' order. The speaker discusses the importance of recognizing the type of variable when analyzing data and how it affects the interpretation of associations.

15:14

📉 Summarizing Data with a Contingency Table

The speaker introduces the concept of a contingency table, used to summarize data on the association between gender and smartphone ownership. The paragraph explains how to construct and interpret this table, which shows the number of individuals in each category, such as the number of male and female students who own or do not own smartphones. It also discusses how to ensure the data adds up correctly across categories.

20:15

📝 Creating a Pivot Table for Data Analysis

The paragraph explains the process of creating a pivot table in Google Sheets to analyze the association between gender and smartphone ownership. It details the steps to select the variables, organize the data, and generate the pivot table, which provides a visual representation of the associations within the dataset. The speaker emphasizes the utility of pivot tables in quickly identifying patterns and relationships in the data.

25:17

🔄 Comparing Ordered and Nominal Variables

This paragraph discusses the analysis of ordinal and nominal variables, specifically income level and smartphone ownership. The speaker explains how to categorize income into high, medium, and low and contrasts this with the nominal variable of smartphone ownership. The paragraph highlights the importance of considering the order of variables when analyzing data and how to represent this order in a contingency table.

🗂 Organizing Data in a Pivot Table

The speaker concludes by demonstrating how to organize the data in a pivot table to reflect the associations between income level and smartphone ownership. The paragraph explains how to code income levels and how to ensure the pivot table accurately represents the distribution of smartphone ownership across different income brackets.

Mindmap

Keywords

💡Variable

In the context of the video script, a 'variable' refers to a symbol or term used to represent a value or an attribute that can change. It is central to understanding the theme as the script discusses the association between different variables. For example, the script mentions 'gender' and 'smartphone ownership' as variables that are being studied for association.

💡Association

The term 'association' in the script is used to describe the relationship or connection between two variables. It is a key concept because the script discusses how to understand and analyze the relationships between different types of variables, such as categorical and numerical. The script specifically talks about the association between gender and smartphone ownership.

💡Categorical Variable

A 'categorical variable' is defined as a variable that can take on one of a limited, and usually fixed, number of possible values, assigning each individual or case to a particular group or category. In the script, gender and smartphone ownership (yes/no) are used as examples of categorical variables, and the analysis of their association is a focus.

💡Numerical Variable

A 'numerical variable' is one that provides a numerical value for each case and can be either discrete or continuous. The script touches on numerical variables in the context of discussing the association between two variables, one of which could be numerical, like income in a market research scenario.

💡Ordinal Variable

An 'ordinal variable' is a type of categorical variable where the categories have a meaningful order or ranking but the differences between them are not necessarily equal. The script introduces ordinal variables by discussing how income can be categorized into high, medium, and low, indicating an order.

💡Data Collection

The process of 'data collection' involves gathering information from various sources and is fundamental to the script's narrative. The script describes creating a dataset from surveying 100 students about their gender and smartphone ownership.

💡Frequency Table

A 'frequency table' is a statistical tool used to summarize data by showing the number of observations in each category. The script refers to creating a frequency table to understand the association between categorical variables such as gender and smartphone ownership.

💡Cross-tabulation

The term 'cross-tabulation' or 'contingency table' is used to describe a type of frequency table that displays the joint frequency distribution of two or more categorical variables. The script explains how to create a cross-tabulation to analyze the relationship between gender and smartphone ownership.

💡Market Research

The script mentions 'market research' as an example of a field where understanding the association between variables is crucial. It is used as a context to discuss how variables like smartphone ownership and income might be studied for association.

💡Google Sheets

The script provides a practical example of using 'Google Sheets' to analyze data. It is mentioned as the tool for creating pivot tables to understand the association between variables, demonstrating a real-world application of the concepts discussed.

💡Pivot Table

A 'pivot table' is a summary of data that aggregates it in a way that can be easily manipulated and analyzed. The script describes the process of creating a pivot table in Google Sheets to explore the relationship between categorical variables like gender and smartphone ownership.

Highlights

The module focuses on understanding the association between two numerical variables.

The importance of recognizing the association between variables without implying causation is discussed.

The concept of nominal variables and their role in data analysis is introduced.

An example of market research is presented to illustrate the association between gender and smartphone ownership.

Data collection methods are explained, emphasizing the importance of capturing gender and smartphone ownership accurately.

The creation of a contingency table to understand the relationship between categorical variables is described.

The significance of relative frequency in analyzing the association between variables is highlighted.

A step-by-step guide on how to use Google Sheets to create a pivot table for data analysis is provided.

The process of categorizing data into nominal and ordinal variables is explained with examples.

The importance of maintaining the order of ordinal variables in the analysis is emphasized.

The concept of income as an ordinal variable and its categorization into high, medium, and low is introduced.

The analysis of the association between smartphone ownership and income level is discussed.

The use of coding to represent different income levels in the analysis is explained.

The final pivot table is presented, showing the distribution of smartphone ownership across different income levels.

The practical application of the analysis in understanding market trends and consumer behavior is discussed.

The importance of careful data interpretation and the potential impact of the findings on business strategies is highlighted.

Transcripts

play00:14

आता पुढील गोष्ट काय आहे?

play00:20

आतापर्यंत आपण फक्त एकाच व्हेरिएबलचा

play00:26

सारांश समजून घेण्यावर लक्ष केंद्रित केले

play00:33

आहे.

play00:34

परंतु बहुतेक वेळा दोन व्हेरिएबल्स

play00:41

एकमेकांशी असोसिएटेड आहेत की नाही हे समजून

play00:49

घेण्यात आपल्याला रस असतो.

play00:54

जेव्हा मी असोसिएशनबद्दल बोलतो तेव्हा मी

play01:01

कार्यकारणभावाचा उल्लेख करत नाही.

play01:06

असोसिएशन नेहमीच कार्यकारणभाव नसते.

play01:11

आपण येथे कार्यकारणभावाबद्दल बोलत नाही, परंतु

play01:18

तुम्ही फक्त व्हेरिएबल्स मधील असोसिएशनबद्दल

play01:24

प्रश्न विचारत आहात.

play01:28

तर, या मॉड्युलमध्ये बोलत आहोत.

play01:34

या प्लॉटचे स्वरूप आणि आपण दोन नुमेरिकल

play01:42

व्हेरिएबल्स मधील असोसिएशन कसे मोजतो.

play01:48

जरी या मॉड्युलचा फोकस प्रामुख्याने

play01:54

दोन कॅटेगरीकल आणि नुमेरिकल व्हेरिएबल्समधील

play02:00

असोसिएशन समजून घेणे हा आहे, तरीही आपण

play02:09

श्रेणी आणि नुमेरिकल व्हेरिएबल्स यांच्यातील

play02:15

संबंध किंवा असोसिएशन याबद्दल कसे बोलाल

play02:22

हे समजून घेण्यासाठी आपण थोडा वेळ घालवतो.

play02:30

तर, ही या आठवड्याची शिकण्याची उद्दिष्टे

play02:38

आहेत.

play02:39

तर, आपण कॅटेगरीकल व्हेरिएबल्स मधील

play02:45

असोसिएशनने सुरुवात करतो.

play02:48

तर, या विभागाचा मुख्य उद्देश काय आहे?

play02:57

तर, आपण ज्याला द्विमार्गी आकस्मिक टेबल म्हणतो

play03:05

ते कसे तयार करायचे ते येथे समजून घेणार

play03:15

आहोत.

play03:16

आपण सापेक्ष फ्रिक्वेंसीची संकल्पना मांडू आणि

play03:23

दोन कॅटेगरीकल व्हेरिएबल्समध्ये असोसिएशन आहे की

play03:31

नाही हे निर्धारित करण्यासाठी तुम्ही

play03:37

सापेक्ष फ्रिक्वेंसी ही संकल्पना कशी

play03:43

वापरू शकता याचा वापर करू.

play03:49

तर, आपण एका उदाहरणाने सुरुवात करूया.

play03:56

आता तुम्ही हे उदाहरण पाहिल्यास माझ्याकडे

play04:03

एक मार्केट रिसर्च फर्म असोसिएटेड आहे

play04:10

की नाही हे शोधण्यात स्वारस्य आहे.

play04:18

दुसऱ्या शब्दांत, कंपनीला हे जाणून

play04:24

घेण्यात रस आहे की पुरुषांच्या तुलनेत

play04:31

अधिक महिलांकडे स्मार्टफोन आहे की नाही किंवा

play04:39

स्मार्टफोनची मालकी एखाद्या व्यक्तीच्या

play04:44

जेंडर पेक्षा स्वतंत्र आहे का.

play04:50

हा मुख्य प्रश्न आहे.

play04:55

तर, आपण या प्रश्नाचे उत्तर कसे द्यायचे?

play05:03

लगेच तुम्हाला दिसेल की जेव्हा मी याबद्दल

play05:12

बोलतो तेव्हा मी प्रत्यक्षात दोन

play05:18

व्हेरिएबल्सवर चर्चा केली आहे.

play05:23

पहिला व्हेरिएबल जेंडर आहे आणि दुसरे

play05:30

व्हेरिएबल स्मार्टफोनची मालकी आहे.

play05:35

तर, आपण हे जेंडर कसे कॅप्चर गृहीत धरत

play05:44

आहे.

play05:46

ज्या प्रकारे मी स्मार्टफोनची मालकी

play05:52

मिळवली आहे ती पुन्हा एका कॅटेगरीकल व्हेरिएबलद्वारे

play06:00

आहे.

play06:01

येथे, तुमच्या मालकीचा फोन असल्यास तुम्ही

play06:09

होय म्हणाल, जर तुमच्याकडे फोन नसेल तर तुम्ही

play06:18

नाही म्हणा.

play06:21

तर, डेटा पाहू.

play06:24

तर, जर तुम्ही डेटा पाहिला तर तुम्हाला

play06:33

दिसेल की हा डेटा आहे.

play06:39

डेटा म्हणजे काय?

play06:42

माझ्याकडे गोळा केलेला डेटा आहे जिथे मी

play06:51

ज्या व्हेरिएबल्सबद्दल बोलत आहे ते मूलत:

play06:58

तुम्ही जेंडर पाहू शकता आणि त्यांच्याकडे

play07:05

स्मार्टफोन आहे की नाही, हा डेटा गोळा

play07:14

केला जातो आणि हा डेटा प्रत्यक्षात

play07:21

100 विद्यापीठातील विद्यार्थ्यांसाठी

play07:25

गोळा केला जातो.

play07:28

तर, डेटा काय आहे?

play07:33

गोळा केलेला डेटा हा 100 महाविद्यालयीन

play07:40

मुलांचा गट आहे ज्यांच्याकडे स्मार्टफोन आहे की

play07:49

नाही याबाबत सर्वेक्षण करण्यात आले.

play07:55

त्यामुळे, गोळा केलेला डेटा प्रत्येक विद्यार्थ्यासाठी

play08:02

काय कॅप्चर केले गेले, जेंडर आणि त्यांच्याकडे

play08:10

फोन आहे की नाही.

play08:15

म्हणून होय, नाही, आणि जेंडर पकडले

play08:22

गेले.

play08:24

म्हणून, उदाहरणार्थ, पहिली व्यक्ती, मी

play08:30

जेंडर विचारतो तो पुरुष असू शकतो.

play08:37

या व्यक्तीकडे सेल फोन असता तर तो होय

play08:47

असता.

play08:48

दुसरी व्यक्ती, पुरुषाकडे फोन नाही.

play08:54

तिसरी व्यक्ती एक महिला असू शकते जिच्याकडे

play09:02

फोन नाही.

play09:05

चवथी व्यक्ती ही एक महिला असू शकते

play09:13

जिच्याकडे फोन आहे, n व्यक्ती, आणि हा

play09:20

डेटा आपण 100 विद्यार्थ्यांसाठी गोळा करतो.

play09:26

तर, येथे दोन व्हेरिएबल जेंडर आहेत.

play09:32

त्यांच्याकडे स्मार्टफोन आहे की नाही हे येथे

play09:39

दुसरे व्हेरिएबल आहे.

play09:42

होय, त्यांच्याकडे फोन असल्यास नंतर

play09:47

त्यांच्याकडे फोन नसल्यास.

play09:50

तर, हा आपण गोळा केलेला डेटा आहे.

play09:57

एकूण निरीक्षणांची संख्या 100 आहे आणि

play10:03

आपण अशा प्रकारे डेटा गोळा केला आहे.

play10:10

तर, या उदाहरणातील कॅटेगरीकल व्हेरिएबल्स

play10:15

काय आहेत?

play10:17

प्रथम श्रेणीबद्ध व्हेरिएबल जेंडर

play10:21

आहे.

play10:22

त्या दोन श्रेणी आहेत आणि आपल्याला

play10:28

माहित आहे की जेंडर हे नॉमिनल व्हेरिएबल

play10:35

आहे.

play10:36

मग पुढील कॅटेगरीकल व्हेरिएबल म्हणजे

play10:41

तुमच्याकडे स्मार्टफोन आहे की नाही.

play10:46

हे व्हेरिएबल जी मूल्ये घेते ती होय

play10:53

आणि नाही आहेत.

play10:56

स्त्री-पुरुष ही मूल्ये जेंडर घेतात.

play11:00

पुन्हा माझ्याकडे दोन श्रेणी आहेत,

play11:05

पुन्हा ते नाममात्र व्हेरिएबल आहे कारण

play11:11

या व्हेरिएबलमध्ये कोणताही क्रम नाही.

play11:16

यास्तव, तुम्ही पाहू शकता की मला माझ्या

play11:23

व्हेरिएबलचा प्रकार काय आहे आणि मापनाचे

play11:29

प्रमाण काय आहे हे माहित असणे आवश्यक

play11:36

आहे.

play11:37

येथे माझ्याकडे मोजमापाच्या नॉमिनल स्केलसह दोन्ही

play11:43

कॅटेगरीकल व्हेरिएबल्स आहेत.

play11:46

तर, आता तुमच्याकडे डेटा आल्यावर आपण

play11:52

डेटा पाहू, हा डेटा आहे ज्याबद्दल मी

play11:59

बोलत आहे.

play12:01

तर, येथे तुमच्याकडे 100 विद्यार्थी आहेत

play12:07

आणि या प्रत्येक निरीक्षणातून मी

play12:12

त्यांचे जेंडर कॉपी करतो आणि त्यांच्याकडे

play12:18

स्मार्टफोन आहे की नाही.

play12:22

तर, माझ्या डेटावरून माझ्याकडे असलेली

play12:27

सारांश आकडेवारी काय आहे?

play12:31

माझ्या डेटावरून माझ्याकडे असलेली

play12:35

सारांश आकडेवारी अशी आहे की माझ्याकडे

play12:41

44 महिला विद्यार्थी आणि 56 पुरुष विद्यार्थी

play12:47

आहेत.

play12:48

लक्षात ठेवा आपण 100 विद्यार्थ्यांना

play12:53

प्रश्न विचारत आहोत.

play12:56

प्रत्येक विद्यार्थ्यासाठी आपण त्यांचे जेंडर

play13:01

काय रेकॉर्ड करतो आणि त्यांच्याकडे

play13:06

स्मार्टफोन आहे की नाही हे आपण रेकॉर्ड

play13:13

करतो.

play13:14

हे आपले सर्वेक्षण आहे.

play13:18

पुढे, 76 विद्यार्थ्यांकडे स्मार्टफोन होता

play13:23

आणि 24 विद्यार्थ्यांकडे नाही.

play13:27

म्हणून, जर तुम्ही ते बघितले तर, आपण

play13:34

मागील आठवड्यांमध्ये जी चर्चा केली होती

play13:40

ती होती, प्रथम मी या जेंडर चा सारांश

play13:48

कसा बनवायचा हे कॅटेगरीकल व्हेरिएबल म्हणून

play13:54

जेंडरकडे पाहिले तर.

play13:57

मला 44 स्त्रिया आणि 56 पुरुष माहित आहेत

play14:05

आपण पाहिले की आपण बार चार्ट वापरून

play14:12

त्याचा सारांश देऊ शकतो.

play14:16

पुन्हा एक स्मार्टफोन आहे की नाही.

play14:22

मालकी होय नाही, माझ्याकडे 76 होय आणि 24 नाही आहेत.

play14:31

पुन्हा या मालकीची दोन मूल्ये आहेत,

play14:37

होय आणि नाही आणि ती दोन्ही येथे 44

play14:45

+ 56,ते 100 पर्यंत जोडतात. 76 + 24,ते 100 पर्यंत जोडतात.

play14:56

आता मला या दोन व्हेरिएबल्समधील असोसिएशन जाणून घ्यायचे

play15:04

आहे.

play15:05

तर, माझ्याकडे आणखी एक डेटा आहे जो माझ्यासाठी

play15:13

उपयुक्त आहे ज्यामध्ये असे म्हटले आहे की

play15:20

34 विद्यार्थिनींकडे स्मार्टफोन होता

play15:24

आणि 42 कडे स्मार्टफोन होता.

play15:29

तर, हा डेटा आहे जो आपल्याला दिला जातो.

play15:37

तर, आपण हा पहिला प्रश्न विचारतो की मी हा

play15:46

डेटा कसा सारांशित करू.

play15:50

तर, माझ्याकडे या टेबलच्या स्वरूपात

play15:55

असलेला हा डेटा पाहता, प्रश्न असा आहे की

play16:03

मी हा डेटा कसा सारांशित करू?

play16:09

माझ्याकडे दोन व्हेरिएबल्स आहेत, पहिले व्हेरिएबल

play16:15

जेंडर आहे.

play16:16

आता या जेंडरला दोन मूल्ये आहेत.

play16:22

मी स्त्री म्हणून लिहितो, मी पुरुष

play16:28

म्हणून लिहितो.

play16:30

तर हे माझे व्हेरिएबल आहे.

play16:35

दुसरे व्हेरिएबल मालकी आहे.

play16:39

आता हे होय आहे किंवा हे नाही आहे हे होय

play16:49

आहे आणि माझ्याकडे एकूण बेरीज आहेत.

play16:55

तर, माझ्याकडे ग्रँड रोव ची एकूण संख्या

play17:02

असल्यास, माझ्याकडे ती येथे आहे, माझ्याकडे

play17:08

येथे एक कॉलम आहे.

play17:12

तर, तुम्ही बघू शकता की येथे दिलेले 44

play17:20

स्त्रिया आहेत, 56 पुरुष आहेत जे येथे

play17:27

दिले आहेत.

play17:29

आता जेव्हा मी मालकीकडे आलो तेव्हा 24 ची मालकी

play17:38

नव्हती, म्हणून माझी संख्या 24, 76 मालकीची

play17:45

आहे.

play17:46

तर, आपण पाहू शकतो की या एकूण 100 विद्यार्थ्यांची

play17:55

भर पडते.

play17:57

ही पहिली गोष्ट आहे.

play18:01

मी आतील टेबल भरण्‍याकडे पाहत नाही, परंतु

play18:07

या 44 स्त्रिया आहेत, माझ्या डेटासेटमध्‍ये

play18:13

56 पुरुष आहेत, 24 मालकीचे नाहीत, 76 मालकीचे

play18:21

आहेत.

play18:22

आता पुढे तर हे मी टेबलबद्ध केले आहे.

play18:30

तर, हे 34 आहे कारण 34 महिलांकडे स्मार्टफोन

play18:38

होता.

play18:39

त्याचप्रमाणे 42 पुरुषांकडे स्मार्टफोन होता.

play18:44

आता किती जणांच्या मालकीचे नव्हते ते

play18:50

सोपे आहे. 10 जे 44 - 34 आहे आणि येथे माझ्याकडे

play19:00

14 आहे जे 56 - 42 आहे.

play19:06

आपण 10 + 14 = 24, 34 + 42 = 76 पाहू शकतो आणि आपण हे देखील

play19:21

तपासू शकतो की 10 + 34 = 44 आणि 14 + 42 = 56.

play19:33

तर , या डेटाचा सारांश किंवा येथे दिलेला

play19:40

डेटा दुतर्फा टेबल म्हणून संदर्भित

play19:45

केला जातो ज्याला अधिक लोकप्रियपणे

play19:50

आकस्मिक टेबल म्हणून संदर्भित केले जाते.

play19:55

आपण आकस्मिक टेबल कसे तयार करू?

play20:01

आकस्मिक टेबल तयार करण्यासाठी आपण पहिले

play20:07

व्हेरिएबल पाहतो.

play20:09

या पहिल्या व्हेरिएबलमधील पहिल्या व्हेरिएबलचे

play20:14

स्तर हे जेंडर आहे आणि त्यात स्त्री

play20:21

आणि पुरुष अशी दोन मूल्ये आहेत.

play20:27

तर, समजा या व्हेरिएबलला 3 मूल्ये लागतात.

play20:34

तर पहिल्या व्हेरिएबलची लेव्हल 1, लेव्हल 2,

play20:41

लेव्हल 3 किंवा लेव्हल m माझ्या रोवमध्ये

play20:48

जाते.

play20:49

मी माझे दुसरे व्हेरिएबल पाहतो.

play20:54

समजा दुसऱ्या व्हेरिएबलची n मूल्ये आहेत.

play21:00

माझ्याकडे लेव्हल 1, लेव्हल 2, लेव्हल

play21:08

n आहे, माझ्याकडे n कॉलम असतील.

play21:10

आणि येथे i, jth कॉलममध्ये जे जाते ते ith व्हेरिएबल

play21:20

आणि jth व्हेरिएबलच्या एकत्रित निरीक्षणांची

play21:22

संख्या आहे.

play21:23

उदाहरणार्थ 34 ही संख्या आहे ज्यांच्याकडे

play21:24

फोन आहे.

play21:25

तर, आकस्मिक टेबल काय आहे हे आपण अशा

play21:26

प्रकारे तयार करतो.

play21:27

आणि आपण पाहू शकता की अशा प्रकारे आपण

play21:28

आकस्मिक टेबलचा सारांश दिला आहे.

play21:29

आता या उदाहरणात, जेंडर आणि स्मार्ट

play21:30

फोनची मालकी या दोन्ही गोष्टींना आपण नॉमिनल

play21:31

व्हेरिएबल म्हणून संबोधले आहे.

play21:32

या व्हेरिएबल मध्ये कोणताही क्रम नव्हता.

play21:33

तर, जर मी माझा आकस्मिक टेबल खालील गोष्टींकडे

play21:34

बघून तयार केला असता, ते पुरुष, महिला, नाही,

play21:36

होय फरक पडला नसता कारण दिलेली माहिती

play21:37

सारखीच आहे.

play21:38

क्रमाने फरक पडला नाही, माझ्याकडे

play21:39

स्त्री आणि पुरुष असो किंवा हो किंवा

play21:40

नाही फरक पडला नसता.

play21:41

त्यामुळे, आकस्मिक टेबलमध्ये तुम्ही

play21:42

ज्या क्रमाने तुमची व्हेरिएबल्स नमूद

play21:43

करत आहात त्या क्रमाने माझे दोन्ही व्हेरिएबल्स

play21:44

नॉमिनल असतील तेव्हा फरक पडणार नाही.

play21:45

आता आपण गूगल शीट्स करतो, आपल्याकडे

play21:46

किती निरीक्षणे आहेत?

play21:47

आपल्याकडे 100 निरीक्षणे आहेत, मी माझा डेटा

play21:48

हायलाइट करतो म्हणून मी जाऊन कॉलम निवडतो.

play21:49

मी आता असोसिएशन शोधत असलेले व्हेरिएबल

play21:50

जेंडर आणि मालकी आहेत.

play21:51

मी ते निवडतो मग मी डेटा टॅबवर करतो.

play21:52

ते चरण 2 आहे, डेटावर जा आणि पिव्होट टेबल

play21:54

पर्यायावर क्लिक करा.

play21:55

आता पिव्होट टेबलमध्ये, पिव्होट टेबल तयार

play21:56

करा.

play21:57

हे विद्यमान शीटमधील मुख्य टेबल संपादक

play21:58

उघडते.

play21:59

मी विद्यमान शीटमधील पिव्होट टेबलवर क्लिक

play22:00

करत असलेल्या डेटावर जाणार आहे.

play22:01

मी फक्त माझ्या पिव्होट टेबलला एक स्थान

play22:02

देणार आहे.

play22:03

मी येथे दिलेले स्थान आणि आता मी क्रिएट

play22:04

वर जातो.

play22:05

रोवज टॅब अंतर्गत प्रथम श्रेणीबद्ध

play22:06

व्हेरिएबल जोडा जे जेंडर आहे.

play22:07

कॉलम्स टॅबच्या खाली, 3.2 स्टेप असलेल्या

play22:08

स्मार्टफोनची मालकी असलेल्या दुसऱ्या

play22:09

कॅटेगरीकल व्हेरिएबलवर क्लिक करा.

play22:10

व्हॅल्यूज टॅबच्या खाली, म्हणून मी इथे

play22:11

परत जातो, व्हॅल्यू टॅबच्या खाली मी

play22:12

व्हेरिएबल्सपैकी एकावर क्लिक करतो.

play22:13

म्हणून, मी येथे जेंडरवर क्लिक केले आहे आणि

play22:14

मी त्याला A गणनेनुसार सारांशित करण्यास

play22:15

सांगत आहे आणि तुम्ही पाहू शकता की मला

play22:16

जे मिळाले ते माझ्याकडे आहे हे माझे तंतोतंत

play22:17

कॅटॅगरीकल किंवा आकस्मिक टेबल आहे

play22:18

जे आपण काही मिनिटांपूर्वी केले होते.

play22:19

तर, तुम्ही पाहू शकता की 34 महिलांकडे फोन

play22:20

आहे, 42 पुरुष आहेत ज्यांच्याकडे फोन

play22:21

आहे, 10 महिलांकडे फोन नाही, 14 पुरुषांकडे

play22:22

फोन नाही, माझ्या डेटासेटमध्ये 42 महिला

play22:23

आणि 56 पुरुष आणि 24 लोकांकडे फोन नाही

play22:24

तर 76 लोकांकडे फोन नाही.

play22:25

हे मला माझ्या डेटासेटवरून मिळते.

play22:26

तर, हे तुमच्या गूगल शीटमधील मुख्य टेबल

play22:28

आहे जे तुम्हाला गूगल शीटमध्ये एक

play22:29

आकस्मिक टेबल देते.

play22:30

तर, जर तुम्ही आधीच्या उदाहरणात पाहिले

play22:31

तर आपल्याकडे दोन नॉमिनल व्हेरिएबल्स

play22:32

आहेत.

play22:33

आता जर माझ्याकडे ऑर्डिनल व्हेरिएबल

play22:34

असेल तर काय होईल?

play22:35

आता इथे दुसरे उदाहरण पाहू.

play22:36

आता आधीच्या गोष्टीत मी पाहिले की जेंडर

play22:37

फोनच्या मालकीशी असोसिएटेड आहे की

play22:38

नाही, मी ते आकस्मिक टेबल वापरून सारांशित

play22:39

करतो.

play22:40

आता मी हे पाहणार आहे की, उत्पन्न खरोखर

play22:41

फोनच्या मालकीशी असोसिएटेड आहे का.

play22:42

तर, पुन्हा आपल्याकडे तोच मार्केट रिसर्च

play22:43

फोन आहे, जो फोनची मालकी पुन्हा स्मार्ट

play22:44

फोनची मालकी आहे की नाही हे शोधण्यात

play22:45

स्वारस्य आहे, येथे माझे व्हेरिएबल एखाद्या

play22:46

व्यक्तीच्या उत्पन्नाशी असोसिएटेड आहे.

play22:47

आता इनकम व्हेरिएबल पुन्हा आहे की आपण

play22:48

हे इन्कम व्हेरिएबल कसे नोंदवायचे.

play22:49

या उदाहरणात, आपल्याकडे एक मार्केट रिसर्च

play22:50

फर्म आहे जी स्मार्टफोनची मालकी उत्पन्नाशी

play22:51

असोसिएटेड आहे की नाही हे शोधण्यात

play22:52

स्वारस्य आहे.

play22:53

तर, येथे दोन व्हेरिएबल्स काय आहेत?

play22:54

पहिला व्हेरिएबल मालकी आहे.

play22:55

आपण आपल्या पूर्वीच्या उदाहरणात पुन्हा

play22:56

हे व्हेरिएबल मानले होते, परंतु आता जेंडर

play22:57

ऐवजी मी उत्पन्नाचा विचार करत आहे.

play22:58

आता हे उत्पन्न कसे नोंदवले जाते?

play22:59

हे उत्पन्न कसे नोंदवले जाते, उत्पन्न जास्त,

play23:00

मध्यम किंवा कमी म्हणून नोंदवले जाते.

play23:01

तर, आपण या उत्पन्नाचे 3 श्रेणींमध्ये वर्गीकरण

play23:02

केले आहे आणि या उत्पन्नाच्या व्हेरिएबल्स ची मूल्ये

play23:03

काय आहेत.

play23:04

ते उच्च, मध्यम आणि निम्न आहे.

play23:05

तर, हे एक कॅटॅगरीकल व्हेरिएबल आहे जिथे

play23:06

मी प्रत्यक्षात गणना करत नाही किंवा मी

play23:08

वास्तविक उत्पन्नाची नोंद केलेली नाही,

play23:09

परंतु मी प्रत्यक्षात या 100 लोकांचे वर्गीकरण

play23:10

केले आहे की ते उच्च उत्पन्न गटातील किंवा

play23:11

मध्यम उत्पन्न गटातील किंवा कमी उत्पन्न

play23:12

गटातील आहेत.

play23:13

आणि या प्रत्येक व्यक्तीला आपण विचारत

play23:14

आहोत की त्यांचे उत्पन्न जास्त उत्पन्न

play23:15

आहे आणि त्यांच्याकडे स्मार्टफोन आहे की

play23:16

नाही.

play23:17

अशा प्रकारे मी माझा डेटा रेकॉर्ड केला

play23:18

आहे.

play23:19

तर, इथे जर तुम्ही आता या केसकडे पाहिले

play23:20

तर माझे व्हेरिएबल्स काय आहेत?

play23:21

पुन्हा कॅटेगरीकल व्हेरिएबल म्हणजे

play23:22

उत्पन्न जे कमी, मध्यम आणि उच्च आहे आणि

play23:23

दुसरे कॅटेगरीकल व्हेरिएबल म्हणजे

play23:24

तुमच्याकडे स्मार्टफोन आहे की नाही.

play23:25

या व्हेरिएबलमध्ये तुमची मालकी असो

play23:26

वा नसो, दोन श्रेणी आहेत, होय श्रेणी

play23:27

आणि नाही श्रेणी.

play23:28

हे एक नॉमिनल व्हेरिएबल आहे तर उत्पन्न ज्यामध्ये

play23:29

कमी, मध्यम आणि उच्च अशा तीन श्रेणी आहेत

play23:30

ते एक ऑर्डिनल व्हेरिएबल आहे कारण कमी, मध्यम

play23:31

आणि उच्च मध्ये ऑर्डर आहे कारण कमी उत्पन्न

play23:33

हे मध्यम उत्पन्नापेक्षा कमी आहे जे उच्च उत्पन्नापेक्षा

play23:34

कमी आहे.

play23:35

म्हणून, जेव्हा तुम्ही दोन नॉमिनल व्हेरिएबल्सचा

play23:36

सारांश देत आहात तेव्हा आठवा.

play23:37

आपण सांगितले की ते टेबलमध्ये ज्या

play23:38

क्रमाने दिसतात ते कोणतेही सुसंगत नाही.

play23:39

तथापि, जेव्हा आपल्याकडे ऑर्डिनल व्हेरिएबल

play23:40

असते तेव्हा ऑर्डर राखणे चांगले असते.

play23:41

यातून आपल्याला काय म्हणायचे आहे?

play23:42

समजा मी पुन्हा त्याच पद्धतीने पुढे चालू

play23:43

ठेवतो.

play23:44

मी उत्पन्न निवडतो आणि माझ्याकडे स्मार्टफोन

play23:45

आहे.

play23:46

मी ही 100 निरीक्षणे निवडतो, मी माझ्या

play23:47

डेटावर जातो, मी माझ्या विद्यमान शीटमधील

play23:48

मुख्य टेबलवर क्लिक करतो.

play23:49

मी येथे माझे पिव्होट टेबल तयार करणार

play23:50

आहे.

play23:51

पुन्हा रोव खाली मी उत्पन्न जोडतो,

play23:52

कॉलमखाली मी स्वतःचा स्मार्टफोन जोडतो

play23:53

आणि मूल्यांखाली मी फक्त उत्पन्न

play23:54

जोडणार आहे, तुम्ही पाहू शकता की हे माझे

play23:55

आकस्मिक टेबल आहे जे माझ्याकडे येथे

play23:56

आहे, परंतु या आकस्मिक टेबलमध्ये तुम्हाला

play23:57

जे लक्षात आले ते प्रथम माझ्याकडे

play23:58

एक उच्च आहे जे येथे हायलाइट केले आहे.

play23:59

तर, आपण जाऊन फक्त आकस्मिक टेबल पाहू.

play24:00

तर, तुम्ही आकस्मिक टेबलमध्ये पाहू शकता,

play24:01

जर तुम्ही उत्पन्नाचा क्रम पाहत असाल, तर

play24:03

तुमचे उत्पन्न जास्त आहे, उत्पन्न कमी

play24:04

आहे आणि मध्यम उत्पन्न आहे.

play24:05

तर वास्तविक क्रम एकतर उच्च, मध्यम,

play24:06

निम्न किंवा निम्न मध्यम, उच्च आहे.

play24:07

हा व्हेरिएबल ज्या क्रमाने दिसतो.

play24:08

त्यामुळे, जेथे व्हेरिएबलचा क्रम असेल तेथे तुम्ही

play24:09

व्हेरिएबलचा गोंधळलेला क्रम पाहू इच्छित

play24:10

नाही.

play24:11

यावर मात करण्याचा एक मार्ग म्हणजे

play24:12

ऑर्डर असणे, उच्च, मध्यम आणि निम्न

play24:13

व्हेरिएबल असणे.

play24:14

मी नुकतेच हे व्हेरिएबल 1, 2, 3 असे कोड केले आहे

play24:15

जेथे 1 उच्च उत्पन्नाचे प्रतिनिधित्व करते,

play24:16

2 मध्यम उत्पन्नाचे प्रतिनिधित्व करते,

play24:17

3 कमी उत्पन्नाचे प्रतिनिधित्व करते.

play24:18

तर, आता जर मी या दोन व्हेरिएबल्समधील

play24:19

आकस्मिक टेबल पाहत असेल तर मी मला आवश्यक

play24:21

असलेली 100 निरीक्षणे निवडतो.

play24:22

मी 100 निरीक्षणे निवडली.

play24:23

मी पुन्हा विद्यमान शीटमधील डेटा, पिव्होट

play24:24

टेबलवर जातो.

play24:25

मी येथे जाऊन डेटा पिव्होट टेबल तयार

play24:26

करणार आहे.

play24:27

मी फक्त यावर क्लिक करेन.

play24:28

मी ते तयार करणार आहे.

play24:29

रोव मी पुन्हा उत्पन्न जोडतो, कॉलम जोडतो

play24:30

की त्यात स्मार्टफोन आहे की नाही, मूल्ये

play24:31

मी पुन्हा मोजणार आहे

play24:32

तर, आता तुम्ही पाहू शकता आणि तुम्ही

play24:33

या दोन टेबलची प्रत्यक्षात तुलना करू शकता, पहिल्या

play24:34

टेबलमध्ये माझ्या उच्च, निम्न आणि मध्यममध्ये

play24:35

ऑर्डर नाही, तर दुसऱ्या टेबलमध्ये, 1 उच्च

play24:36

उत्पन्न गटाचे प्रतिनिधित्व करते, 2 मध्यम उत्पन्न

play24:37

गटाचे प्रतिनिधित्व करते आणि 3 कमी उत्पन्न

play24:38

गटाचे प्रतिनिधित्व करतो.

play24:39

तर, तुम्ही पाहू शकता की ऑर्डर आकस्मिक

play24:40

टेबलमध्ये जतन केलेली आहे.

play24:41

म्हणून, जेव्हाही तुमच्याकडे ऑर्डिनल

play24:42

व्हेरिएबल असेल तेव्हा शिफारस केली जाते

play24:43

की ऑर्डर तुमच्या आकस्मिक टेबलमध्ये

play24:44

जतन केली जाईल.

play24:45

तर, शेवटी माझा आकस्मिक टेबल काय पाहतो.

play24:46

माझ्याकडे हा डेटा आहे आणि हा डेटा वापरून

play24:47

तुम्ही हे पाहू शकता की संबंधित टेबल,

play24:48

या डेटाशी संबंधित आहे माझ्याकडे उच्च,

play24:50

मध्यम, निम्न ऑर्डर आहे त्यांच्या मालकीचा

play24:51

स्मार्टफोन असला किंवा नसला तरीही

play24:52

उत्पन्नामध्ये जतन केले जाते.

play24:53

माझ्याकडे जास्त उत्पन्न असलेले 20

play24:54

लोक आहेत, 66 मध्यम आहेत, 14 लोक कमी उत्पन्न

play24:55

आहेत.

play24:56

यापैकी 162 लोकांकडे फोन आहे, तर 38 लोकांकडे

play24:57

फोन नाही..

play24:58

उच्च उत्पन्न असलेल्या 20 लोकांपैकी 18 लोकांकडे

play24:59

फोन आहे, 2 लोकांकडे फोन नाही. 14 पैकी अल्प

play25:00

उत्पन्न गट 9 कडे फोन नाही, 5 कडे फोन आहे.

play25:01

66 पैकी माझ्याकडे 27 लोक आहेत ज्यांच्याकडे

play25:02

फोन नाही आणि 39 ज्यांच्याकडे फोन आहे..

play25:03

तर, या उपविभागाच्या शेवटी तुम्हाला बायव्हारिएट

play25:09

कॅटेगरीकल डेटा आहे, ith पातळी आणि jth पातळी

play25:17

किती व्हेरिएबल आहे आणि व्हेरिएबल 2 ची

play25:23

व्हेरिएबल jth पातळी आहे, व्हेरिएबल 1,

play25:29

ith पातळी आणि व्हेरिएबल 2, jth पातळी आहे.

play25:37

तेथे या विशिष्ट सेलमध्ये आणि यालाच

play25:42

आकस्मिक टेबल म्हणून संबोधले जाते.

play25:47

सावधगिरीचा एक शब्द, जर डेटा ऑर्डिनल

play25:53

असेल, तर टेबलमधील व्हेरिएबलचा क्रम

play25:58

कायम ठेवा.

Rate This

5.0 / 5 (0 votes)

Related Tags
Market ResearchData AnalysisVariable AssociationCategorical DataNumerical DataSmartphone OwnershipGender StudyIncome LevelsResearch MethodsGoogle SheetsData Summarization