LANDSAT 8 | Definisi, Cara Kerja, Anatomi, Hasil Citra | Perpetaan & SIG | #LANDSAT8 #composite
Summary
TLDRThis video script offers an in-depth look at Landsat 8, a collaborative satellite between NASA and the United States Geological Survey (USGS), launched in 2013 for Earth observation. It orbits the globe every 99 minutes, capturing over 550 images daily with its two main sensors: OLI (Operational Land Imager) and TIRS (Thermal Infrared Sensor). The script explains the satellite's operation, its 11 spectral bands each with specific wavelengths and resolutions, and their applications in mapping and monitoring land features, vegetation health, and water bodies. The video also guides viewers on accessing the satellite's imagery for free on the USGS website and touches on the importance of different image combinations for various analyses.
Takeaways
- 🚀 The Landsat 8 satellite, owned by the United States, was launched on February 11, 2013, and is a collaboration between NASA and the United States Geological Survey (USGS).
- 🌐 Landsat 8 orbits the Earth every 99 minutes, completing a full circuit of the globe every 16 days, capturing images of the Earth's surface.
- 📸 As of August 2020, Landsat 8 has collected over half a million images, with an average of 550 images per day, which are accessible for free on the USGS website.
- 🔍 The satellite is equipped with two main sensors: the Operational Land Imager (OLI) for capturing visible, near-infrared, and shortwave-infrared light, and the Thermal Infrared Sensor (TIRS) for detecting heat.
- 🌈 Landsat 8 images are categorized based on the differences in wavelengths captured by various sensors, allowing for detailed analysis of the Earth's surface.
- 📊 The satellite has 11 spectral bands, each with specific wavelengths and spatial resolutions, which are used for different types of analysis, such as vegetation health, land use, and geological formations.
- 🌿 The OLI sensor includes bands for panchromatic (black and white), multispectral (color), and a high-resolution coastal/aerosol band, while TIRS focuses on thermal data with two bands.
- 🌍 The images from Landsat 8 can be used to create natural color composites (using Red, Green, and Blue bands), false color infrared (for vegetation analysis), and other composites that highlight specific features or conditions on Earth.
- 🛠️ Data processing from Landsat 8 can be done using specialized software, which allows for detailed analysis and interpretation of the satellite imagery.
- 🌐 The script also mentions the availability of educational videos from USGS and NASA's Scientific Visualization Studio to help understand the satellite's operations and the anatomy of Landsat 8.
Q & A
What is the main topic of the video?
-The main topic of the video is the Landsat 8 satellite, which is a remote sensing satellite owned by the United States, focusing on its definition, anatomy, operation, and the types of images it produces.
When was the Landsat 8 satellite launched?
-The Landsat 8 satellite was launched on February 11, 2013.
What is the collaboration behind the Landsat 8 satellite?
-Landsat 8 is a collaboration between NASA and the United States Geological Survey (USGS).
How often does the Landsat 8 satellite orbit the Earth?
-Landsat 8 orbits the Earth every 99 minutes.
What is the significance of the 99-minute orbit of Landsat 8?
-The 99-minute orbit allows Landsat 8 to complete a full pass over the Earth's surface and return to the same location every 16 days.
How many images has Landsat 8 collected by August 2020?
-By August 2020, Landsat 8 had collected half a million images.
How many images does Landsat 8 capture daily?
-Landsat 8 captures approximately 550 images each day.
What are the two main sensors on the Landsat 8 satellite?
-The two main sensors on the Landsat 8 satellite are the Operational Land Imager (OLI) and the Thermal Infrared Sensor (TIRS).
What is the difference between the images produced by the OLI and TIRS sensors?
-The OLI sensor produces images with higher spatial resolution, suitable for detailed land surface observations, while the TIRS sensor focuses on thermal data, providing information about land surface temperature.
What is the spatial resolution of the images captured by the Landsat 8 sensors?
-The spatial resolution varies by sensor and band: OLI has a resolution of 30 meters for the panchromatic band, 15 meters for the multispectral bands, and TIRS has a resolution of 100 meters.
How many bands does Landsat 8 have, and what are they used for?
-Landsat 8 has 11 bands, each capturing different wavelengths and colors, used for various applications such as vegetation analysis, land use mapping, and geological feature identification.
How can the images from Landsat 8 be accessed?
-The images from Landsat 8 can be accessed for free on the USGS website, where users can download and analyze the satellite data.
Outlines

Cette section est réservée aux utilisateurs payants. Améliorez votre compte pour accéder à cette section.
Améliorer maintenantMindmap

Cette section est réservée aux utilisateurs payants. Améliorez votre compte pour accéder à cette section.
Améliorer maintenantKeywords

Cette section est réservée aux utilisateurs payants. Améliorez votre compte pour accéder à cette section.
Améliorer maintenantHighlights

Cette section est réservée aux utilisateurs payants. Améliorez votre compte pour accéder à cette section.
Améliorer maintenantTranscripts

Cette section est réservée aux utilisateurs payants. Améliorez votre compte pour accéder à cette section.
Améliorer maintenantVoir Plus de Vidéos Connexes

Korean satellite avoids space debris after collision warning 과학기술위성3호, 우주파편과 충
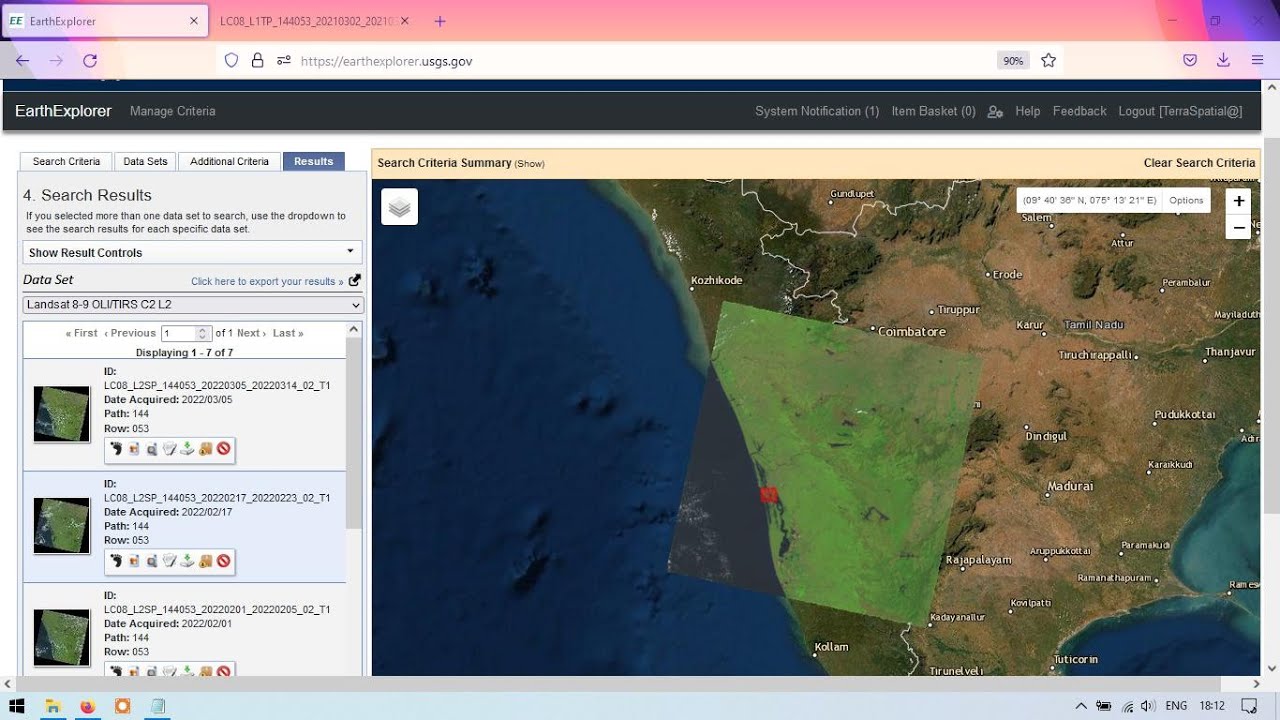
Download Landsat 8 images from EarthExplorer / USGS
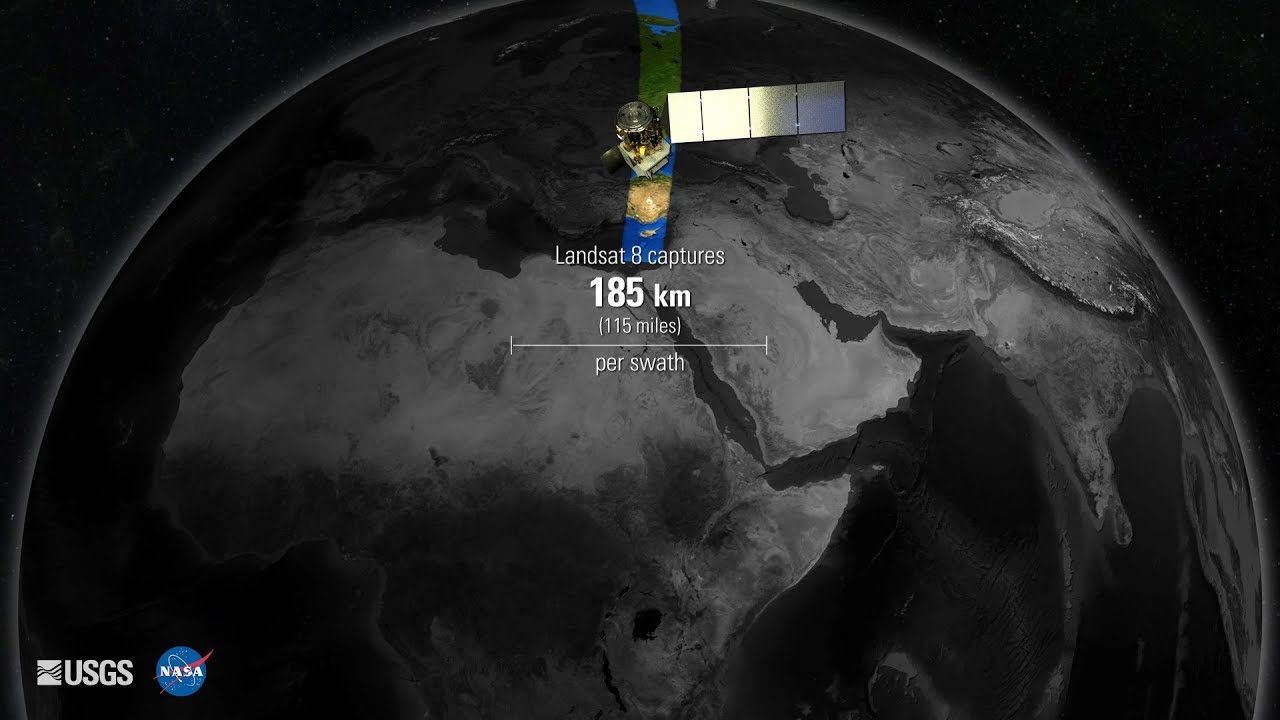
Landsat 8 Swath Animation

How does Starlink Satellite Internet Work?📡☄🖥
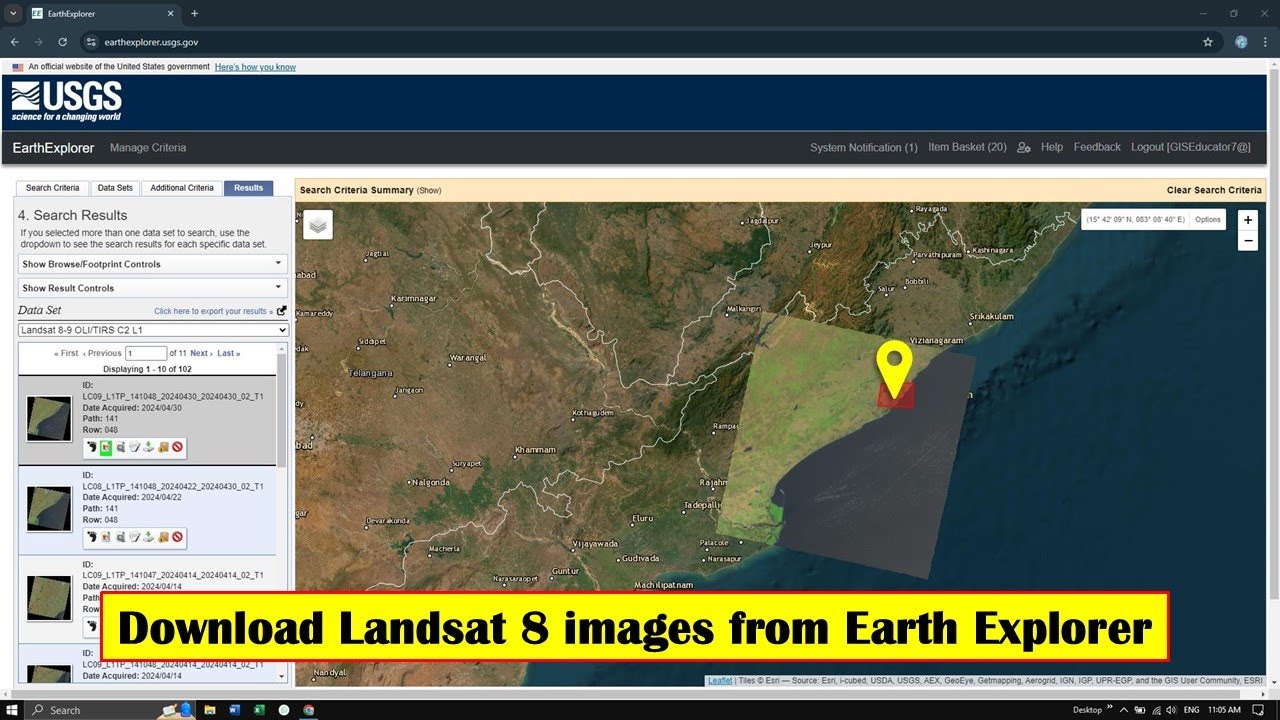
How to Download Landsat 8 image from Earth Explorer | Free

PHL-made microsatellite Diwata 1, tagumpay na inilunsad patungong International Space Station
5.0 / 5 (0 votes)
