Understanding Confidence Intervals: Statistics Help

Dr Nic's Maths and Stats
26 Mar 201304:02

Summary

TLDRThe video script delves into the concept of confidence intervals, essential for understanding sampling and its inherent error. It explains that due to sampling error, different samples from the same population will yield varying results. To estimate population parameters like the mean weight of apples in an orchard, a confidence interval is used, reflecting the precision of our estimate. The width of this interval is influenced by the population's variation and the sample size, with smaller intervals indicating higher certainty. Larger, more varied populations and smaller sample sizes result in wider intervals, signifying less certainty. The script emphasizes that all population parameter estimates should be presented as confidence intervals, highlighting their importance in statistical inference.

Takeaways

  • 🔍 Understanding Confidence Intervals begins with grasping the concepts of sampling and sampling error.
  • 📊 A sample is a subset of a population, used to infer characteristics about the entire population.
  • 🎯 Different sampling methods like simple random, convenience, etc., can be explored for various research needs.
  • ⚖ Inference is drawing conclusions about a population based on sample data, acknowledging that samples are not perfect representations.
  • 🌟 Sampling error is the variation between samples due to the fact that they are only a part of the whole population.
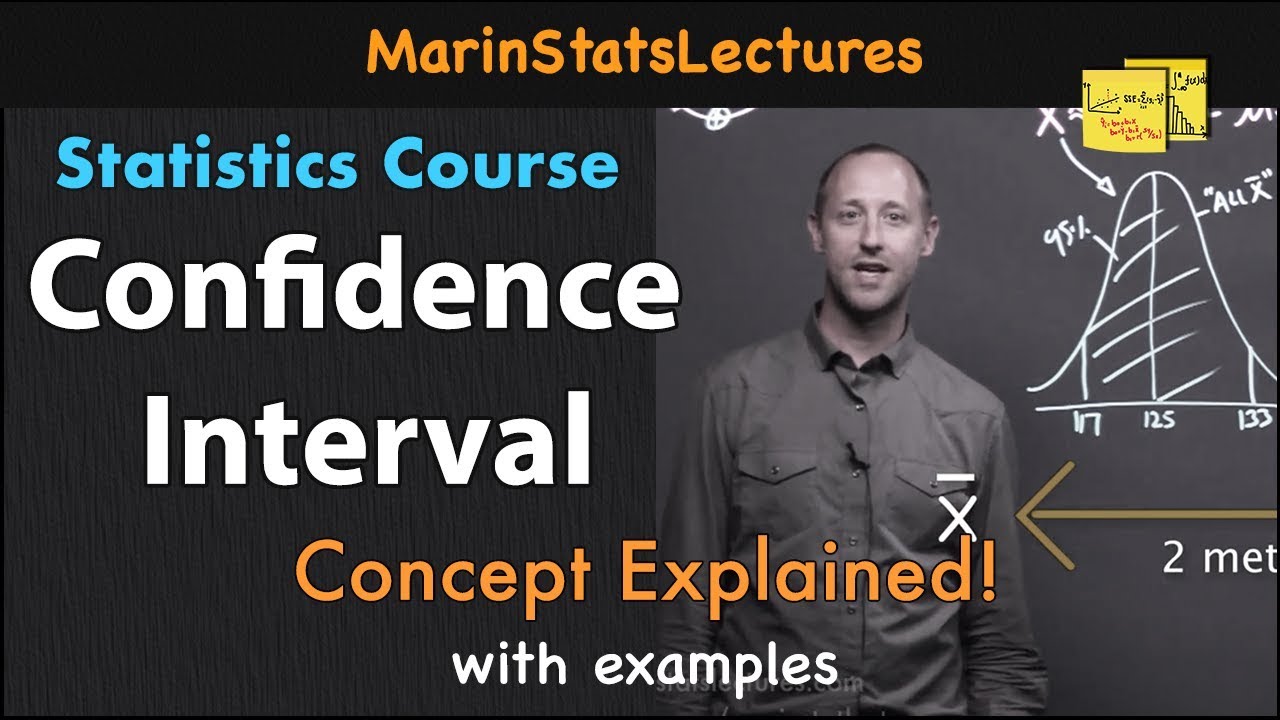
  • 📉 Confidence Intervals are used to express the range within which the population parameter is likely to fall, indicating the estimate's precision.
  • 🍏 The example of apple weights in an orchard illustrates how a sample mean can be used to estimate the population mean.
  • 📏 The width of a confidence interval is influenced by the population's variation and the sample size.
  • 📉 Smaller populations with less variation result in narrower confidence intervals, suggesting greater precision.
  • 📈 Larger sample sizes generally lead to narrower confidence intervals as they provide more information and reduce sampling error.
  • 🔱 Calculating confidence intervals can be done through various methods, with the level of confidence affecting the interval's width.

Q & A

  • What is the purpose of taking a sample from a population?

    -The purpose of taking a sample from a population is to draw conclusions about the entire population when it is impractical or impossible to measure all members of the population.

  • Why is sampling error inevitable when taking a sample?

    -Sampling error is inevitable because a sample is only a subset of the population and will never perfectly represent the entire population, leading to variation in the results from different samples.

  • What is the role of inference in statistics?

    -Inference in statistics involves using the data from a sample to make estimates or predictions about the characteristics of the larger population from which the sample was drawn.

  • How does the concept of a confidence interval help in expressing population estimates?

    -A confidence interval provides a range within which the true population parameter is likely to fall, indicating the precision of the estimate and accounting for the uncertainty due to sampling error.

  • What factors affect the width of a confidence interval?

    -The width of a confidence interval is affected by the variation within the population and the size of the sample. Greater variation and smaller sample sizes lead to wider intervals.

  • Why is it important to consider the variation within the population when calculating a confidence interval?

    -Considering the variation within the population is important because it directly influences the confidence interval's width. A more varied population requires a wider interval to account for the increased sampling error.

  • How does sample size impact the confidence interval?

    -A larger sample size generally leads to a smaller confidence interval because larger samples are more representative of the population, reducing the effect of sampling error.

  • What is the significance of the confidence level in determining the width of a confidence interval?

    -The confidence level indicates the probability that the calculated interval contains the true population parameter. A higher confidence level typically results in a wider interval to ensure a higher probability of capturing the true value.

  • Why should all estimates of population parameters be expressed as confidence intervals?

    -Expressing estimates as confidence intervals provides a clear indication of the estimate's precision and the level of uncertainty, which is crucial for making informed decisions based on the data.

  • Can you provide an example of how a confidence interval might be used in a practical scenario?

    -In a practical scenario, a researcher might use a confidence interval to estimate the average weight of apples in an orchard. The interval would provide a range that the true average weight is likely to fall within, based on the sample data.

  • What are some methods for calculating confidence intervals mentioned in the script?

    -The script mentions traditional confidence interval formulas as a method for calculating intervals, but it does not specify particular formulas. It also suggests that there are other videos that provide more detailed methods for calculation.

Outlines

00:00

📊 Understanding Confidence Intervals

This paragraph introduces the concept of confidence intervals in the context of statistical sampling. It explains that to understand confidence intervals, one must first grasp the idea of sampling and sampling error. Sampling is the process of selecting a subset of a population to infer characteristics about the whole. Sampling error arises because different samples from the same population can yield different results, and this variation is inherent. The paragraph emphasizes that when estimating population parameters, such as the mean weight of apples in an orchard, it's common to express the estimate as a confidence interval. This interval reflects the range within which the true population parameter is likely to fall, and its width is influenced by the variation within the population and the sample size. Smaller samples are more susceptible to sampling error, leading to wider intervals, while larger samples provide more precise estimates, thus narrowing the interval. The paragraph concludes by mentioning that there are various methods for calculating confidence intervals, and the level of confidence chosen also affects the interval's width.

Mindmap

Keywords

💡Confidence Intervals

Confidence intervals are a range of values that are likely to contain a population parameter, such as the mean, with a certain level of confidence. In the video, confidence intervals are used to express the accuracy of the estimate of the mean weight of apples in an orchard. They communicate the precision of the sample-based estimate and are crucial for understanding the reliability of the data derived from a sample.

💡Sampling

Sampling refers to the process of selecting a subset of individuals from a larger population for the purpose of representing and studying the entire population. The video uses the example of taking a sample of apples from an orchard to estimate the average size of all the apples. Sampling is essential because it allows for the study of a population without measuring every single member.

💡Sampling Error

Sampling error, or variation due to sampling, is the difference between the sample results and the true population values. It is an inherent part of sampling because no sample can perfectly represent the entire population. The video explains that different samples of the same population will yield different results, leading to this error, which is always present in sampling.

💡Inference

Inference in statistics involves drawing conclusions about a population based on the analysis of a sample. The video emphasizes that inference allows us to make predictions or estimations about the entire population from the data gathered from a sample. It is a fundamental concept in statistical analysis, as it enables researchers to extend the findings from a sample to the whole population.

💡Population

A population in statistics is the entire group of individuals or items of interest that a researcher wants to study. In the context of the video, the population is all the apples in an orchard at a given time. The video discusses how researchers use samples to make inferences about the population's characteristics, such as the average size of the apples.

💡Sample Mean

The sample mean is the average value of a sample, calculated by adding up all the values in the sample and dividing by the number of values. In the video, the sample mean is used as the best estimate for the population mean. It is a key statistic in estimating the central tendency of a population based on sample data.

💡Variation

Variation refers to the differences or fluctuations within a set of data. The video explains that the variation within the population of interest affects the width of the confidence interval. A population with less variation will lead to a smaller confidence interval because the samples are likely to be more similar to each other and to the population.

💡Sample Size

Sample size is the number of observations or individuals included in a sample. The video discusses how the size of the sample influences the width of the confidence interval. Larger samples tend to provide more accurate estimates and thus have narrower confidence intervals because they are less affected by sampling error.

💡Level of Confidence

The level of confidence in statistical terms refers to the probability that the calculated confidence interval will contain the true population parameter. The video mentions that the stated level of confidence affects the width of the confidence interval, with higher levels of confidence leading to wider intervals to account for the increased certainty.

💡Population Parameter

A population parameter is a numerical value that describes a characteristic of an entire population. In the video, the population parameter is the mean weight of all the apples in the orchard. Confidence intervals are used to estimate the range within which the population parameter is likely to fall, providing a measure of the precision of the estimate.

Highlights

Understanding confidence intervals requires knowledge of sampling and sampling error.

A sample is a subset of a population used to make inferences about the whole.

Sampling methods are crucial for understanding the representativeness of a sample.

Inference from a sample to a population is limited by sampling error.

Confidence intervals are used to express the precision of an estimate of a population parameter.

The sample mean is the best estimate of the population mean.

Confidence intervals provide a range within which the population parameter is likely to lie.

The width of a confidence interval is influenced by the variation within the population.

Less variation in the population leads to a narrower confidence interval.

Greater variation in the population results in a wider confidence interval.

Sample size significantly affects the width of a confidence interval.

Small samples lead to more variation and larger sampling error.

Larger samples provide more information and can result in a smaller confidence interval.

Several methods exist for calculating confidence intervals, each with its own level of confidence.

The stated level of confidence impacts the width of the confidence interval.

All estimates of population parameters should be expressed as confidence intervals.

Further learning resources are available for calculating confidence intervals.

Transcripts

play00:01

Understanding Confidence Intervals

play00:04

In order to understand confidence intervals, we need to understand

play00:07

sampling and sampling error.

play00:10

To find things that about a population of interest,

play00:13

it is common practice to take a sample.

play00:16

A sample is a selection of objects or observations taken from the population of interest.

play00:22

For example, a population might be all apples in an orchard at a given time.

play00:27

We wish to know how big the apples are.

play00:30

We can't measure all of them so we take a sample of some of them and measure them.

play00:35

To find out about different sampling methods,

play00:37

see our video, "Sampling: Simple, Random, Convenience, etc."

play00:42

Inference is when we draw conclusions about the population from the sample.

play00:48

Because the sample was only a selection of objects from the population, it will

play00:52

never be a perfect representation of the population.

play00:56

Different samples of the same population will give different results.

play01:00

This is called sampling error or variation due to sampling.

play01:04

There will always be sampling error.

play01:08

Confidence Intervals

play01:10

When we express an estimate of a population parameter,

play01:13

it is good practice to give it as a confidence interval.

play01:17

A confidence interval communicates how accurate our estimate is likely to be.

play01:24

Say we wish to find out how big the apples are in our orchard.

play01:28

We put this as an investigative question:

play01:31

What is the main weight of all the apples in the orchard?

play01:34

We take a sample, and calculate the sample mean.

play01:38

This is the best estimate of the population mean.

play01:41

We use a confidence interval to express the range in which we are pretty sure

play01:45

the population parameter lies.

play01:48

In this case the population parameter is the mean weight for all the apples in the orchard.

play01:58

The width of a confidence interval depends on two things:

play02:01

The variation within the population of interest,

play02:04

and the size of the sample.

play02:09

If all the values in the population were almost the same,

play02:13

then our sample will also have little variation.

play02:16

Any sample we take is likely to be pretty similar to any other sample.

play02:21

Our estimate is going to be pretty close to the true population value.

play02:25

We would have a small confidence interval.

play02:28

But a more varied population will lead to a more varied sample.

play02:32

Different samples taken of the same population will differ more.

play02:37

We would be less sure that the sample mean was close to the population mean.

play02:41

Our confidence interval would be larger.

play02:43

So, greater variation in the population leads to a wider confidence interval.

play02:50

Sample size also affects the width of a confidence interval.

play02:54

If we take a small sample, we don't have much information on which to base

play02:58

our inference.

play03:00

Small samples will vary more from each other.

play03:02

There is more variation due to sampling, or sampling error,

play03:06

with a small sample.

play03:07

In larger samples, the effect of a few unusual values is evened out by the other

play03:11

values in the sample.

play03:13

Larger samples will be more similar to each other.

play03:17

The effect of sampling error is reduced with larger samples.

play03:21

When we take a large sample,

play03:23

We have more information and can be more sure about our estimate.

play03:26

The confidence interval can be smaller.

play03:29

There are several methods for calculating confidence intervals:

play03:38

When we use traditional confidence interval formulas, the stated level

play03:42

of confidence also effects the width of the confidence interval.

play03:47

All estimates of population parameters, such as means, medians,

play03:50

differences of means and differences in medians

play03:52

should be expressed as confidence intervals.

play03:56

You can learn more about how to calculate confidence intervals in our other videos.

Rate This
★
★
★
★
★

5.0 / 5 (0 votes)

Étiquettes Connexes
Confidence IntervalsStatistical SamplingSampling ErrorPopulation ParametersSample SizeEstimation AccuracySampling MethodsStatistical InferenceData AnalysisResearch Methods
Besoin d'un résumé en anglais ?