7D Example 8
Summary
TLDRThe video script explains the process of sketching the graph of the function y equals 10 to the x without using technology. It starts by discussing the sine function, identifying its zeros and asymptotes. The tutorial then moves on to graph y equals 10 to 2x, explaining the effects of horizontal dilation and period adjustment. The instructor sketches the graph, adjusting for the new period and scale factor, and marking the x-intercepts. The final graph shows more oscillations due to the halved period, providing a clear visual of the function's behavior.
Takeaways
- 📐 The video script is a tutorial on sketching the graph of y = tan(x) without using technology.
- 📈 The instructor emphasizes the importance of understanding the basic properties of the sine and cosine functions for graphing.
- 🔍 The graph is sketched over the interval from -π to π, focusing on the significant points within this range.
- 📍 The zeros of the sine function and the zeros of the cosine function are identified to establish the asymptotes of the tangent function.
- 📉 The original function y = tan(x) is graphed, showing its characteristic oscillations and asymptotes at ±π/2.
- 🔄 The transformation to y = tan(2x) involves a horizontal dilation, which affects the period and the position of the asymptotes.
- 🔢 The period of the tangent function is halved when the argument of the tangent function is multiplied by 2, changing from π to π/2.
- 📉 The scale factor for the transformation is 1/2, which causes the graph to compress horizontally.
- 📌 New asymptotes are calculated as ±π/4, resulting from the horizontal dilation of the original asymptotes.
- 🖊️ The final graph of y = tan(2x) is sketched, showing more frequent oscillations due to the reduced period and the new positions of the asymptotes.
Q & A
What is the main topic discussed in the video script?
-The main topic discussed in the video script is the process of sketching the graph of the function y equals 10 to the power of x without using technology.
What is the first step the instructor takes in sketching the graph?
-The first step the instructor takes is to determine the range of x values, which is from -π to π.
Why does the instructor choose to focus on the window from -π to π?
-The instructor focuses on the window from -π to π because it is the standard range for sketching trigonometric functions like sine and cosine, which are related to the tangent function being discussed.
What are the zeros of the sine function as mentioned in the script?
-The zeros of the sine function mentioned in the script are at x = π and x = 2π.
What are the asymptotes for the tangent function as discussed in the script?
-The asymptotes for the tangent function are at x = π/2 and x = -π/2.
How does the instructor modify the graph of y = 10^x to get y = 10^(2x)?
-The instructor modifies the graph of y = 10^x to get y = 10^(2x) by applying a horizontal dilation, reducing the period to π/2 and scaling the graph by a factor of 1/2.
What is the new period of the function y = 10^(2x) after the modification?
-The new period of the function y = 10^(2x) after the modification is π/2.
What are the new asymptotes for the function y = 10^(2x) after the modification?
-The new asymptotes for the function y = 10^(2x) after the modification are at x = π/4 and x = -π/4.
How does the instructor indicate x-intercepts on the graph?
-The instructor indicates x-intercepts on the graph by marking them with black dots at the points where the function crosses the x-axis.
What is the final appearance of the graph for y = 10^(2x) according to the script?
-The final appearance of the graph for y = 10^(2x) is a series of oscillations between the new asymptotes, with the period halved and more oscillations visible within the window from -π to π.
Outlines

Cette section est réservée aux utilisateurs payants. Améliorez votre compte pour accéder à cette section.
Améliorer maintenantMindmap

Cette section est réservée aux utilisateurs payants. Améliorez votre compte pour accéder à cette section.
Améliorer maintenantKeywords

Cette section est réservée aux utilisateurs payants. Améliorez votre compte pour accéder à cette section.
Améliorer maintenantHighlights

Cette section est réservée aux utilisateurs payants. Améliorez votre compte pour accéder à cette section.
Améliorer maintenantTranscripts

Cette section est réservée aux utilisateurs payants. Améliorez votre compte pour accéder à cette section.
Améliorer maintenantVoir Plus de Vidéos Connexes

Menggambar Grafik Fungsi Rasional #fazanugas

RAIZ DA FUNÇÃO AFIM - Professora Angela Matemática

Find a function’s output value when given an input value

How to find the domain and the range of a function given its graph (example) | Khan Academy

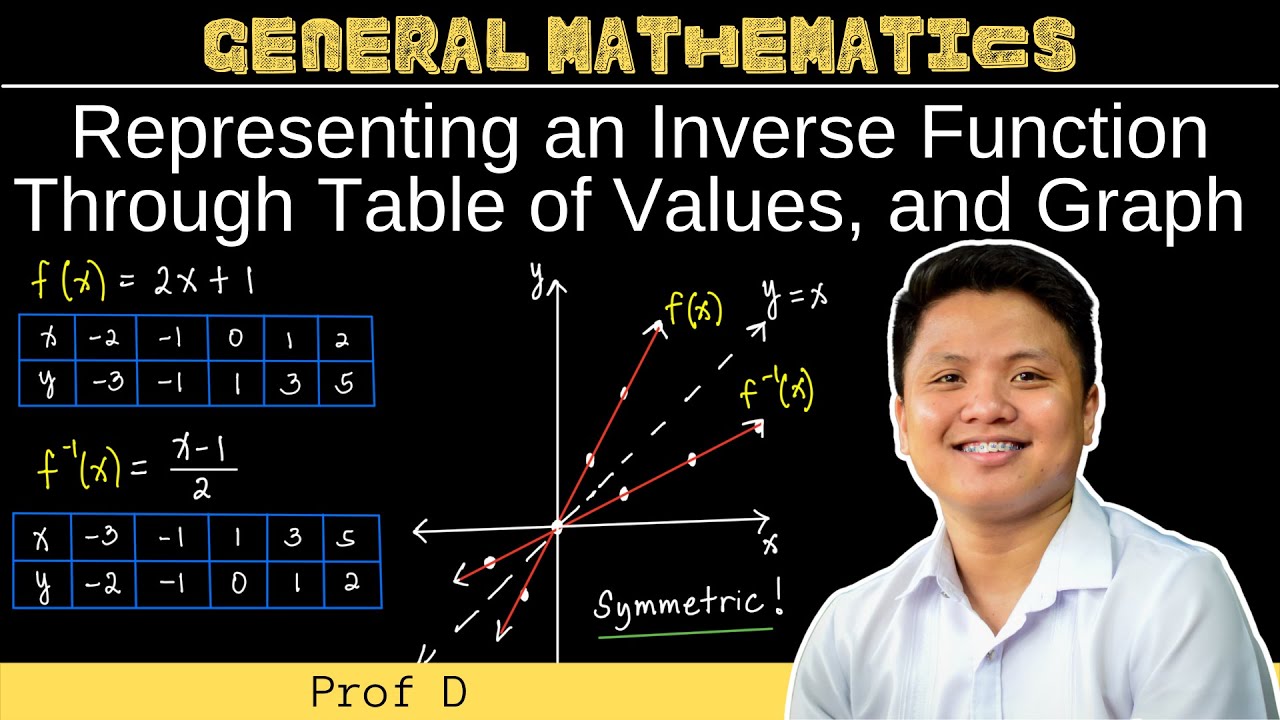
Representing an Inverse Function Through Table of Values, and Graph | General Mathematics

RÁPIDO e FÁCIL | COMO CONSTRUIR GRÁFICO DA FUNÇÃO DO 1º GRAU
5.0 / 5 (0 votes)
