Representing an Inverse Function Through Table of Values, and Graph | General Mathematics
Summary
TLDRThis video lesson explains how to represent an inverse function using a table of values and a graph. The instructor demonstrates the process by starting with the one-to-one function f(x) = 2x + 1, deriving its inverse, and showing how to create a table of values for both the function and its inverse. The video highlights how the graphs of these functions are symmetric about the line y = x. The instructor concludes by summarizing the key concepts and encouraging viewers to ask questions in the comments section.
Takeaways
- 📊 The video is about representing inverse functions using tables of values and graphs.
- 🔢 The example used is a one-to-one function f(x) = 2x + 1, and the inverse is derived.
- 🔄 To find the inverse function, x and y are interchanged, resulting in y = (x - 1) / 2.
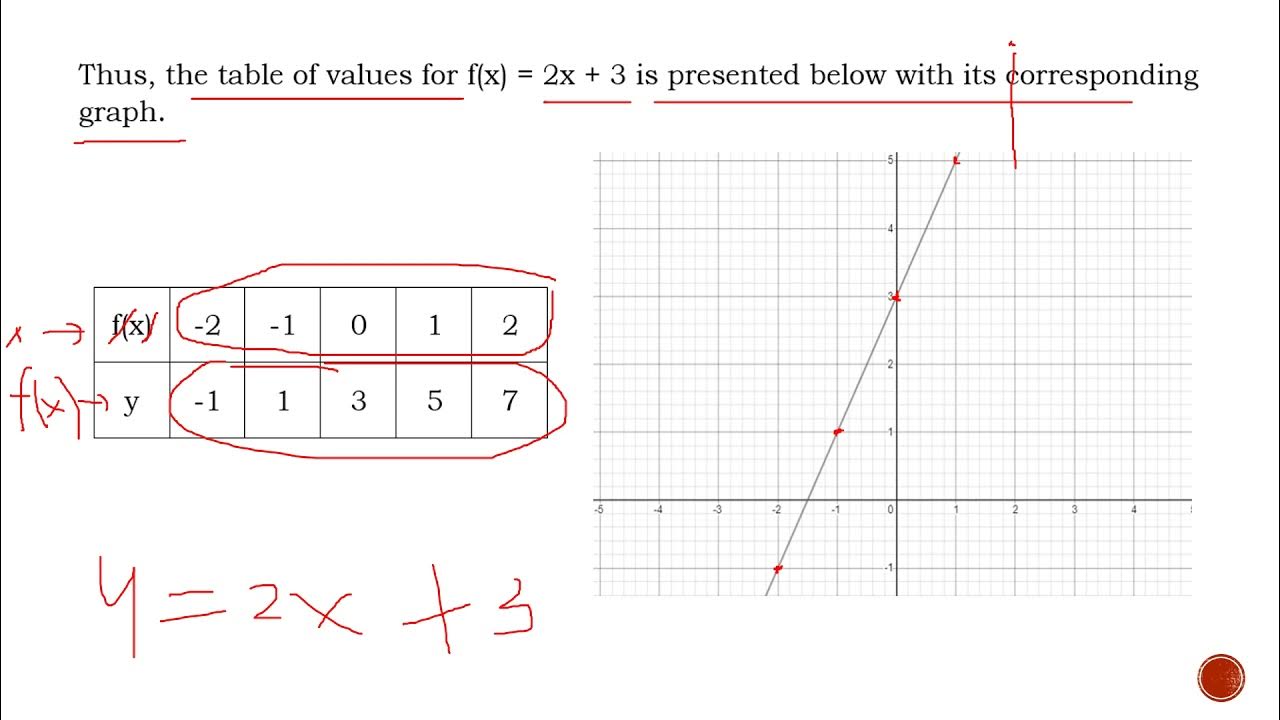
- ✏️ A table of values is created for both the original function and its inverse.
- 📉 The x-values for the table are: -2, -1, 0, 1, and 2. The corresponding y-values are calculated.
- 📈 The table shows the function's outputs: (-2, -3), (-1, -1), (0, 1), (1, 3), and (2, 5).
- 🖊 The inverse function's values are plotted similarly: (-3, -2), (-1, -1), (1, 0), (3, 1), and (5, 2).
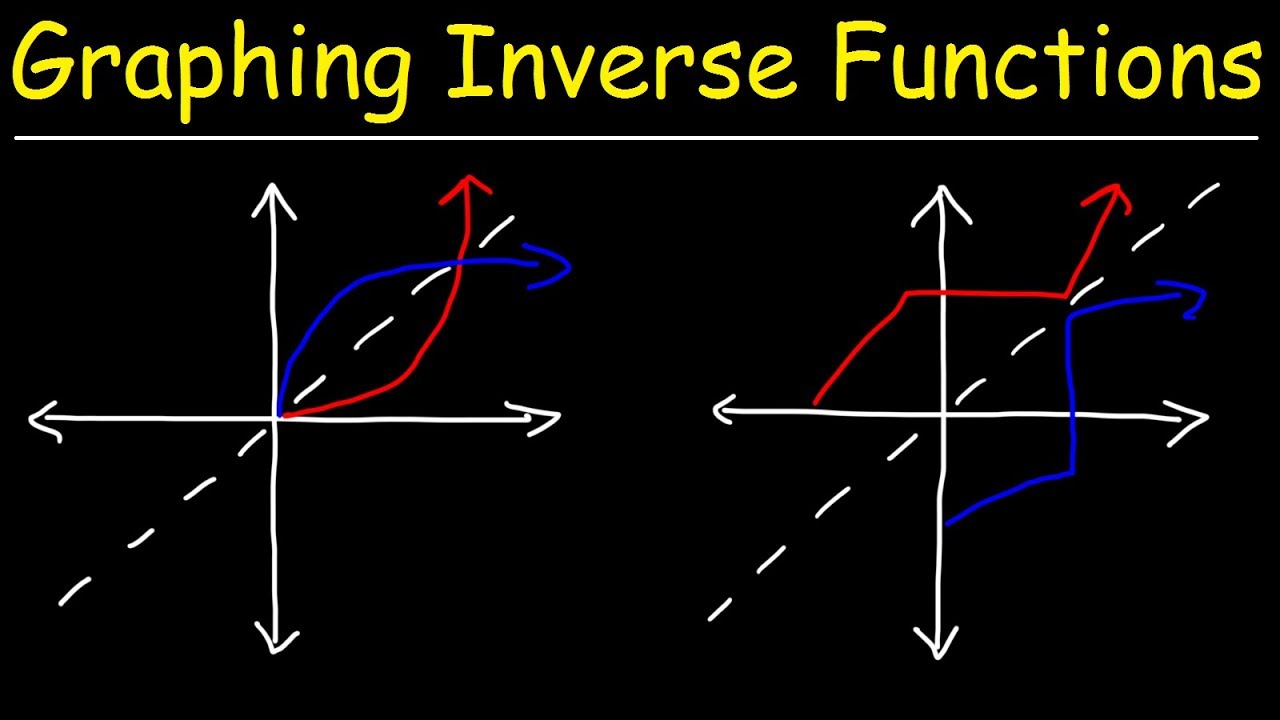
- 🔍 The graph of the original function and its inverse are symmetrical around the line y = x.
- 🧮 The symmetry of the graphs demonstrates that the original function and inverse are reflections of each other.
- ✅ The video concludes with a review, encouraging viewers to leave questions in the comments if they have any.
Q & A
What is the main topic of the video?
-The main topic of the video is about representing an inverse function through a table of values and a graph.
What is the given one-to-one function in the example?
-The given one-to-one function in the example is f(x) = 2x + 1.
How is the inverse function found from the original function f(x) = 2x + 1?
-To find the inverse function, the variables x and y are interchanged, then solve for y. The resulting inverse function is f⁻¹(x) = (x - 1) / 2.
What values of x are used to create the table of values for the original function?
-The x values used to create the table of values for the original function are -2, -1, 0, 1, and 2.
How are the corresponding y values for the original function calculated?
-The corresponding y values are calculated by substituting each x value into the original function f(x) = 2x + 1. For example, for x = -2, f(x) = 2(-2) + 1 = -3.
What is the table of values for the inverse function based on the original function?
-The table of values for the inverse function is created by switching the roles of the x and y values from the original function. For example, if f(x) = -3 when x = -2, then for the inverse function f⁻¹(x), f⁻¹(-3) = -2.
What does the graph of the inverse function represent?
-The graph of the inverse function represents the reflection of the original function across the line y = x, showing the symmetry between the original and inverse functions.
How are the points for the original and inverse functions plotted on the Cartesian plane?
-The points for the original function are plotted by using the table of values for f(x), and the points for the inverse function are plotted using the corresponding table for f⁻¹(x). The two sets of points are reflected across the line y = x.
What do we notice about the relationship between the graphs of the original and inverse functions?
-The graphs of the original function and its inverse are symmetric with respect to the line y = x, meaning that they are mirror images of each other across this line.
What does it mean for the original function and inverse function to be symmetric with respect to y = x?
-Symmetry with respect to y = x means that every point (a, b) on the graph of the original function corresponds to a point (b, a) on the graph of the inverse function, and vice versa. This symmetry reflects the idea of swapping the roles of x and y in the functions.
Outlines

This section is available to paid users only. Please upgrade to access this part.
Upgrade NowMindmap

This section is available to paid users only. Please upgrade to access this part.
Upgrade NowKeywords

This section is available to paid users only. Please upgrade to access this part.
Upgrade NowHighlights

This section is available to paid users only. Please upgrade to access this part.
Upgrade NowTranscripts

This section is available to paid users only. Please upgrade to access this part.
Upgrade NowBrowse More Related Video
REPRESENTATIONS OF AN INVERSE FUNCTIONS | General Mathematics | Quarter 1 - Module 13

Graph & illustrates Linear Function Find the Domain Range Table of values Intercepts & Slope Math 8
Graphing Inverse Functions
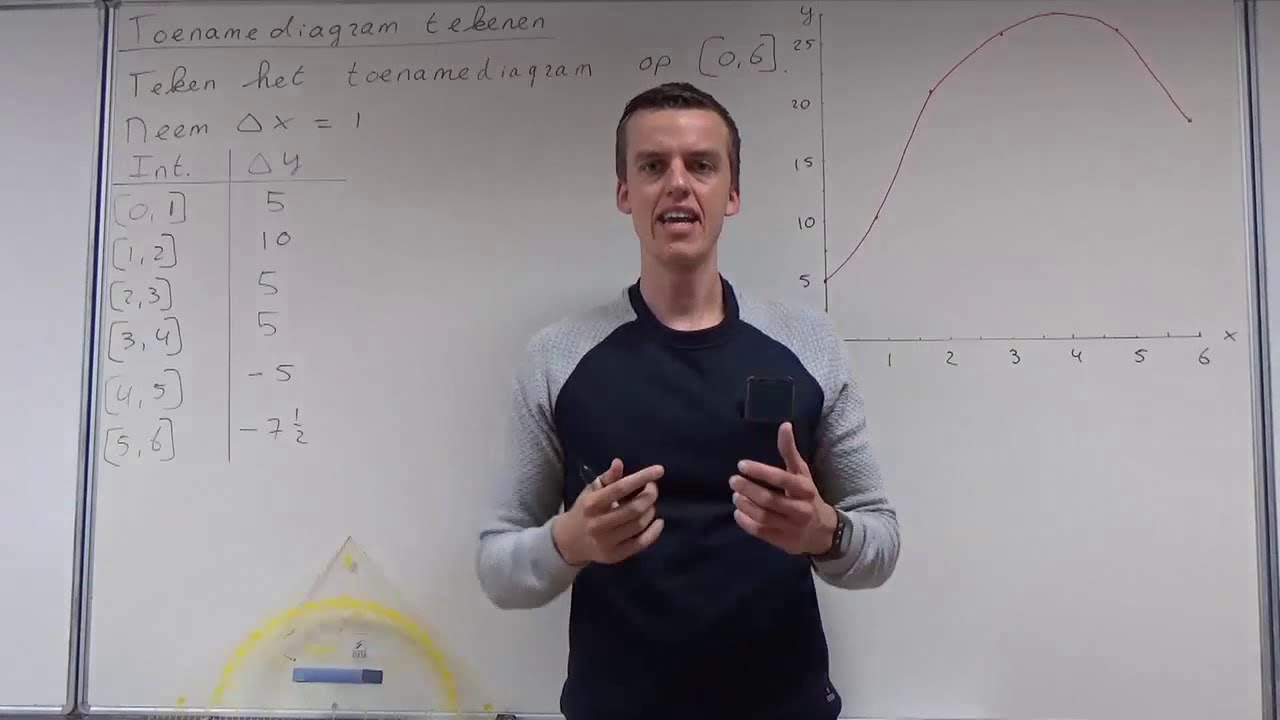
Toenamediagram tekenen bij een grafiek (HAVO wiskunde A/B & VWO wiskunde A)
3.1 Functions
Trigonometri Matematika Kelas 10 • Part 32: Menggambar Grafik Fungsi y=cos x dengan Lingkaran Satuan
5.0 / 5 (0 votes)