How To Graph Trigonometric Functions | Trigonometry

The Organic Chemistry Tutor
14 Apr 202122:36

Summary

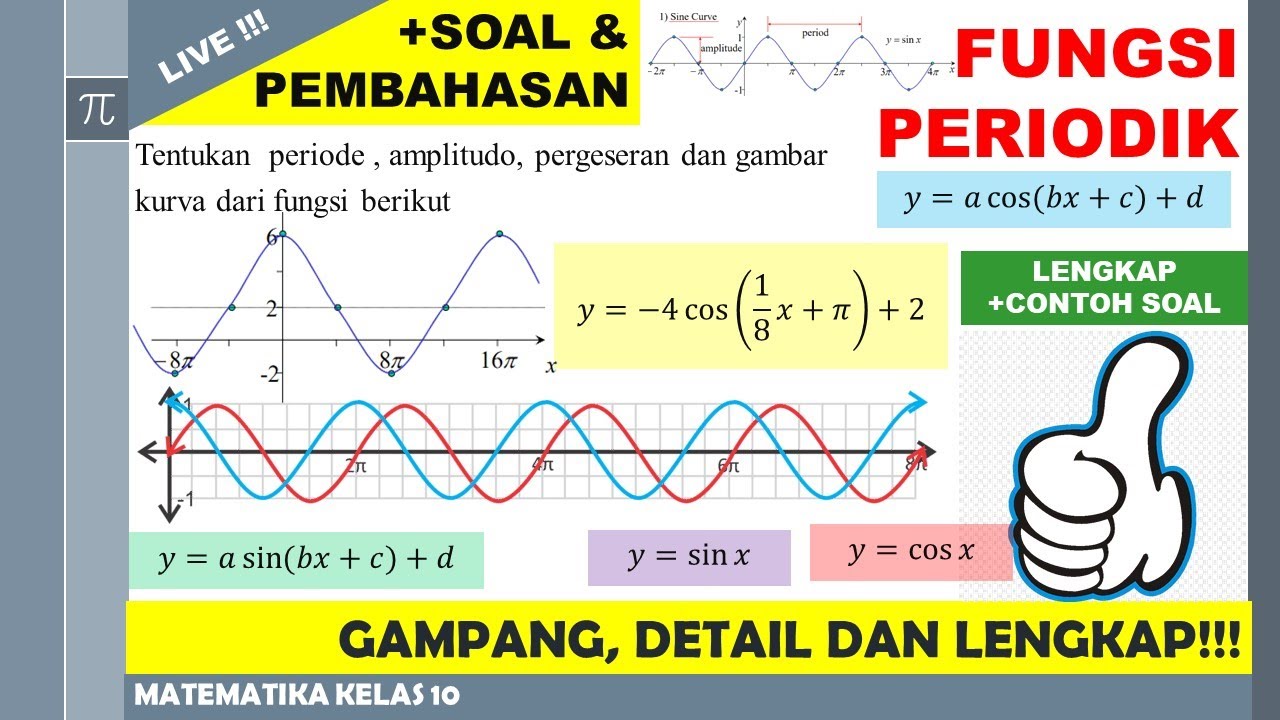
TLDRThis educational video script delves into the intricacies of graphing trigonometric functions, focusing on the sine and cosine functions. It explains how the amplitude affects the vertical stretch or compression of the graph, and how the period is calculated using the formula 2π divided by the coefficient of x. The script also covers phase shifts, detailing how to determine them and their impact on the graph's starting point. Practical examples, such as graphing 'y = 2 sin(x)' and 'y = -3 cos(x)', are provided to illustrate these concepts, making the complex nature of trigonometric graphing more accessible.

Takeaways

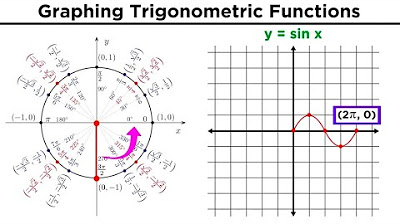
  • 🌊 The sine function, \( \sin x \), graphs as a sinusoidal wave with one period ending at \( 2\pi \).
  • 🔄 Adding a negative sign in front of the sine function flips the wave over the x-axis, inverting its direction.
  • 📈 The cosine function, \( \cos x \), starts at the top for one period, unlike sine which starts at the center.
  • 🔄 Negative cosine function graphs start at the bottom and follow a similar pattern to negative sine but inverted vertically.
  • 📊 Graphing multiple cycles involves breaking each cycle into four key points to plot the wave accurately.
  • 🔝 The amplitude of a sine wave is determined by the coefficient 'a' in front of the sine function, indicating the wave's peak height from the midline.
  • 🔄 Doubling the amplitude, as in \( 2\sin x \), stretches the graph vertically, with the wave varying from -2 to 2.
  • 🔢 The amplitude of a cosine function is the absolute value of the coefficient in front of cosine, as in \( -3\cos x \) where the amplitude is 3.
  • ⏱ The period of a sine or cosine function is found by dividing \( 2\pi \) by the coefficient 'b' in front of 'x', affecting the wave's horizontal stretch.
  • 🔄 A vertical shift in the graph is indicated by a constant added to the function, such as in \( \sin x + 3 \), which raises the entire wave by 3 units.
  • 🔄 Phase shifts in trigonometric functions are calculated by setting the inside of the function to zero and solving for 'x', determining where the wave starts on the x-axis.

Q & A

  • What is the basic shape of the sine function, sine x?

    -The sine function, sine x, is a sinusoidal function that forms a sine wave. It oscillates between -1 and 1, starting at the origin, going up to 1, back down to -1, and then back to the origin, completing one full cycle at 2π.

  • How does the graph of sine x change if a negative sign is placed in front of it?

    -Placing a negative sign in front of the sine function, as in -sine x, flips the graph over the x-axis. Instead of starting at the origin and going up, it starts at the origin and goes down, creating a wave that oscillates between -1 and 1 in the opposite direction.

  • What is the starting point of the cosine function, cosine x, on the graph?

    -The cosine function, cosine x, starts at the top of its cycle, which is the value 1 on the y-axis, as opposed to the sine function that starts at the center (origin).

  • How does the graph of cosine x differ when a negative sign is included, as in -cosine x?

    -For -cosine x, the graph starts at the bottom of the wave, going up to the middle, then to the top, back to the middle, and then back down, completing one cycle.

  • What are the four useful points to consider when graphing one cycle of the sine wave?

    -The four useful points to consider when graphing one cycle of the sine wave are π/2, π, 3π/2, and 2π. These points help in breaking up the cycle into four intervals for easier graphing.

  • What is the amplitude of the sine wave and how is it represented in the function's formula?

    -The amplitude of the sine wave is the distance from the midline of the wave to its peak (or trough). It is represented by the coefficient 'a' in the function's formula, as in a sin(bx + c) + d, where 'a' is the amplitude.

  • How does the amplitude affect the graph of the sine function when it is doubled, as in 2 sine x?

    -Doubling the amplitude, as in 2 sine x, causes the graph to stretch vertically. The wave will now oscillate between -2 and 2 instead of the usual -1 and 1 range.

  • What is the domain and range of the cosine graph for the function y = -3 cosine x?

    -The domain of the cosine graph for y = -3 cosine x is all real numbers, as it is for all sine and cosine functions. The range is from the lowest y-value, which is -3, to the highest y-value, which is 3.

  • How does the period of the sine function change with the value of 'b' in the function a sin(bx)?

    -The period of the sine function is determined by the value of 'b' and is calculated as 2π/b. If 'b' is increased, the period decreases, causing the graph to complete more cycles in the same horizontal distance.

  • What is a phase shift in trigonometric functions and how do you calculate it?

    -A phase shift is a horizontal shift to the left or right of the graph of a trigonometric function. It is calculated by setting the inside of the function equal to zero and solving for 'x', which gives the phase shift value. For example, in the function a sin(bx + c), the phase shift is -c/b.

Outlines

00:00

📈 Introduction to Graphing Sine and Cosine Functions

This paragraph introduces the concept of graphing trigonometric functions, specifically focusing on the sine function. The sine function is described as a sinusoidal wave, with one cycle depicted from 0 to 2π. The effect of placing a negative sign in front of the sine function is explained, which results in the wave flipping over the x-axis. The paragraph also briefly discusses the cosine function, contrasting its starting point with that of the sine function. The focus is on graphing one period of the wave, which is broken down into four key points for clarity. The importance of plotting these points before graphing the entire wave is emphasized.

05:01

🔍 Exploring Amplitude and Graphing Techniques

The paragraph delves into the concept of amplitude in the context of sine waves, using the generic formula a * sin(bx + c) + d to explain that 'a' represents the amplitude. It illustrates how the amplitude affects the vertical stretch or compression of the sine wave, using examples to show how different amplitudes change the graph. The amplitude is defined as the distance from the midline to the highest or lowest point of the wave. The process of graphing the cosine function with a negative amplitude is also discussed, with a step-by-step guide on how to plot one period of the graph, taking into account the starting point, amplitude, and the typical wave pattern.

10:05

🔗 Understanding Period and Vertical Shifts

This section explains the concept of the period in trigonometric functions, demonstrating how the period is affected by the value of 'b' in the function a * sin(b * x). It uses examples to show how increasing or decreasing 'b' impacts the horizontal compression or stretching of the graph. The paragraph also introduces the idea of vertical shifts, explaining how to graph functions with a vertical shift by plotting the new center line and adjusting the amplitude accordingly. Examples of graphing sine and cosine functions with different amplitudes and vertical shifts are provided, emphasizing the method of plotting key points to construct the graph.

15:06

📉 Graphing with Phase Shifts and Vertical Shifts

The paragraph discusses the impact of phase shifts on the graph of sine and cosine functions. It explains how to calculate the phase shift by setting the inside of the function to zero and solving for 'x'. The phase shift determines where the wave starts on the x-axis. The process of graphing a sine function with a phase shift is detailed, including plotting the phase shift point and then adding one period to find additional points on the graph. The amplitude and period of the function are also considered in the graphing process. An example of graphing a sine function with both a phase shift and a vertical shift is provided, illustrating the steps to plot the graph correctly.

20:07

🌟 Advanced Graphing with Multiple Shifts and Amplitude Changes

This final paragraph covers more complex graphing scenarios involving both phase and vertical shifts, as well as changes in amplitude. It provides a method for graphing functions with these elements, starting with plotting the vertical shift and then determining the phase shift. The amplitude and period are recalculated based on the function's parameters. The paragraph walks through an example of graphing a sine function with a phase shift and vertical shift, explaining how to find the range of the graph and plot the sine wave accordingly. It concludes with a comprehensive example that ties together all the concepts discussed in the previous paragraphs.

Mindmap

Keywords

💡Sine Function

The sine function, often denoted as sin(x), is a fundamental mathematical function that describes the periodic oscillation of a point on a unit circle as it rotates with respect to the x-axis. In the context of the video, the sine function is used to illustrate a sinusoidal wave, which is a smooth, repetitive wave form. The video explains that plotting one cycle of the sine wave involves focusing on key points like pi/2, pi, 3pi/2, and 2pi, which help in graphing the wave from its starting point at the origin, going up to the peak, down to the trough, and back to the origin.

💡Negative Sine Function

The negative sine function, represented as -sin(x), is a variation of the sine function where the wave is reflected over the x-axis. This means that instead of starting at the origin and moving upwards, the wave starts at the origin and moves downwards, creating a mirror image of the standard sine wave. The video script uses this concept to demonstrate how the shape of the sine wave changes when a negative sign is introduced, emphasizing the importance of understanding the effects of algebraic manipulation on the graph of trigonometric functions.

💡Cosine Function

The cosine function, or cos(x), is another trigonometric function that, like the sine function, describes the position of a point on the unit circle as it rotates. Unlike the sine function, which starts at the origin, the cosine function starts at the top of the unit circle. The video script explains that graphing the cosine function involves plotting points at intervals of pi/2, pi, 3pi/2, and 2pi, similar to the sine function, but with the wave starting at the peak instead of the center.

💡Amplitude

Amplitude in the context of trigonometric functions refers to the distance from the midline of the wave to its peak (or trough). It is a measure of the wave's height and is represented by the coefficient 'a' in the equation 'a * sin(b * x + c) + d'. The video script discusses how the amplitude affects the graph of the sine and cosine functions, explaining that a larger amplitude results in a wave that extends further from the midline, both upwards and downwards.

💡Period

The period of a trigonometric function is the length of one complete cycle of the wave. It is determined by the coefficient 'b' in the equation 'a * sin(b * x + c) + d' and is calculated as 2π divided by 'b'. The video script uses the period to explain how the frequency of the wave changes; a smaller period means the wave completes more cycles within the same interval, resulting in a more compressed graph horizontally.

💡Phase Shift

A phase shift in trigonometric functions refers to the horizontal displacement of the wave from its standard position. It is represented by the coefficient 'c' in the equation 'a * sin(b * x + c) + d'. The video script demonstrates how to calculate the phase shift by setting the inside of the function to zero and solving for 'x'. This shift can either delay or advance the start of the wave on the x-axis, and the video provides examples of how to graph functions with phase shifts.

💡Vertical Shift

A vertical shift is the upward or downward movement of the entire graph of a trigonometric function. It is represented by the coefficient 'd' in the equation 'a * sin(b * x + c) + d'. The video script explains that a vertical shift affects the midline of the wave, changing the starting point of the wave from the x-axis to a higher or lower value. The video provides examples of how to graph functions with vertical shifts, including how to adjust the amplitude and period accordingly.

💡Domain and Range

In the context of trigonometric functions, the domain refers to the set of all possible input values (x-values), while the range refers to the set of all possible output values (y-values). The video script clarifies that the domain for sine and cosine graphs is all real numbers, as these functions are defined for any real number input. The range, however, is determined by the amplitude and any vertical shifts, with the lowest y-value being the amplitude below the midline and the highest y-value being the amplitude above the midline.

💡Graphing

Graphing in the context of the video refers to the process of visually representing trigonometric functions using a coordinate system. The video script provides a detailed step-by-step guide on how to graph sine and cosine functions, including identifying key points, calculating amplitude and period, and adjusting for phase and vertical shifts. The process involves plotting these points and connecting them to form the sinusoidal wave, which is essential for understanding the behavior of these functions.

💡Sinusoidal Wave

A sinusoidal wave is a smooth, repetitive wave form that is described by trigonometric functions such as sine and cosine. The video script emphasizes the characteristics of a sinusoidal wave, including its periodic nature and the way it oscillates between a maximum and minimum value. The video uses the sinusoidal wave to teach the viewer how to graph and understand the properties of trigonometric functions, highlighting the importance of this wave form in mathematics and its applications in various fields.

Highlights

Sine function is a sinusoidal wave, oscillating between positive and negative values.

Negative sine function inverts the wave, starting downwards from the origin.

The sine wave is periodic, repeating its pattern infinitely.

Cosine function starts at the peak, unlike sine which starts at the center.

Negative cosine function starts at the bottom and mirrors the positive cosine wave.

Graphing one period of a trigonometric function involves breaking it into four key points.

Amplitude determines the vertical stretch or compression of a sine wave.

The amplitude is the absolute value of the coefficient in front of the sine or cosine function.

The period of a sine or cosine function is calculated as 2π divided by the coefficient of x.

Graphing multiple periods involves extending the key points accordingly.

Vertical shifts in a trigonometric graph are represented by adding or subtracting a constant.

Phase shifts occur when there is a horizontal translation of the graph, calculated by setting the inside of the function to zero.

The domain of sine and cosine functions is all real numbers, while the range depends on the amplitude.

Graphing a function with a phase shift requires plotting from the phase shift point rather than the origin.

Combining vertical and horizontal shifts with amplitude adjustments results in a comprehensive graph of a trigonometric function.

Transcripts

play00:01

now let's talk about graphing

play00:02

trigonometric functions

play00:05

let's start with

play00:07

the sine function

play00:09

sine x

play00:12

sine x is basically a sinusoidal

play00:14

function it's a sine wave

play00:17

and that's how it looks like

play00:19

at least that's one period

play00:21

this ends at two pi that's one cycle of

play00:23

the wave

play00:25

now let's say if you put a negative in

play00:26

front of the sine function

play00:31

it's going to flip over the x-axis so

play00:33

instead of going up initially it's going

play00:35

to start from the origin it's going to

play00:37

go down and then back up

play00:39

and then back down

play00:42

so that's the shape of sine and negative

play00:44

sign now keep in mind

play00:46

this wave keeps on going forever in both

play00:48

directions

play00:49

but

play00:50

for the course of this lesson i'm going

play00:52

to focus on graphing one period

play00:55

which is basically one cycle of the wave

play01:04

now what about the graphs of cosine x

play01:07

and negative cosine

play01:10

x cosine

play01:13

starts at the top

play01:14

whereas sine starts at the center

play01:18

so that's one period of the cosine wave

play01:21

let me do that a little bit better

play01:25

but it can continue going on forever

play01:30

negative cosine starts at the bottom

play01:33

it goes up

play01:34

to the middle and then goes up and then

play01:36

back down

play01:37

so that's the graph of one period of

play01:40

negative cosine

play01:42

so this is one cycle

play01:46

now let's go back to the sine graph

play01:49

let's draw two cycles

play01:51

of this graph

play01:55

so one cycle

play01:57

you need to

play01:58

break it up into four

play02:00

useful points

play02:04

one cycle is two pi

play02:07

you want to break that up into four

play02:08

points such as pi over two pi and three

play02:11

pi over two

play02:13

now if we want another period let's add

play02:15

two pi to it

play02:17

so we want to go to four pi in between

play02:19

two pi and four pi is three pi and

play02:22

between two pi and three pi

play02:24

it's five pi over two

play02:26

you add these two then divide by two

play02:28

if we add three pi and four pi that's

play02:30

seven pi

play02:31

and then divided by two we get seven

play02:33

over two

play02:35

sine starts at the center

play02:38

and then it's going to go up

play02:40

back to the middle

play02:42

down

play02:43

back to the middle so that's one cycle

play02:45

of the sine wave

play02:48

and then it's going to go back up

play02:50

back to the middle

play02:52

down and then back to the middle that's

play02:54

why it's helpful to plot the points

play02:56

first

play02:57

before

play02:58

putting everything else

play03:00

if you break up each cycle into five key

play03:04

points

play03:05

which equates to four intervals

play03:08

it's going to be easier to graph the

play03:09

sine wave

play03:11

let's do the same for cosine

play03:19

let's graph

play03:20

two periods of the cosine wave

play03:24

so one period is going to be two pi

play03:26

two periods

play03:27

four pi

play03:28

for each period or each cycle break it

play03:31

up into five

play03:32

points which is four intervals

play03:37

the first point by the way is the origin

play03:38

it's zero

play03:43

so these points will be the same as

play03:45

the graphics sign

play03:53

now we know that cosine starts at the

play03:55

top

play03:56

it's going to go back to the middle

play03:58

and then to the bottom

play04:00

back to the middle

play04:01

and then to the top and it's going to

play04:03

alternate

play04:09

so it's going to look something like

play04:10

this

play04:13

so that's one cycle

play04:20

and here's the second cycle

play04:22

so that's two cycles of the cosine wave

play04:27

now let's talk about the amplitude of

play04:29

the sine wave

play04:33

the generic formula is a

play04:35

sine

play04:37

bx plus c

play04:39

plus d

play04:40

now we're going to focus on a

play04:43

a the number in front of sine is the

play04:45

amplitude

play04:47

so in this case the amplitude

play04:49

is equal to 1.

play04:52

so when you graph the sine wave

play04:56

you plot your four points of interest

play04:58

for one full cycle

play05:00

the amplitude is going to be one

play05:03

so it's going to vary from one to

play05:04

negative one

play05:07

so we know sine starts at the center

play05:10

it's going to go to the top

play05:12

back to the middle and then to the

play05:13

bottom and then back to the middle

play05:16

so it's going to look like this

play05:18

and we know the period is 2 pi

play05:22

now what if we wanted to graph

play05:24

two sine x

play05:27

so if we increase the amplitude this

play05:29

graph is going to stretch

play05:31

vertically

play05:41

so it's going to vary from 2 to negative

play05:43

2. by the way this is the amplitude

play05:48

it's the distance between

play05:50

the midline of the sine wave

play05:52

and

play05:54

the highest point

play06:00

now let's plot one period

play06:02

so this is going to be 2 pi

play06:04

so once again sine is going to start

play06:07

at the middle then it's going to go up

play06:10

back to the middle and then down and

play06:12

then back to the middle

play06:18

so it's going to look like that

play06:21

and so the amplitude tells you how much

play06:23

it's going to stretch or compress

play06:25

vertically

play06:27

consider the equation

play06:29

y is equal to negative 3 cosine x

play06:33

what is the amplitude

play06:35

of this function

play06:37

the amplitude is always a positive

play06:39

number so you ignore the negative sign

play06:41

and it's going to be 3.

play06:43

the amplitude is the absolute value of a

play06:45

the number in front of cosine

play06:48

now let's go ahead and graph it

play06:52

let's plot one period

play06:56

so let's break it up into five points

play07:00

or four intervals

play07:02

now the amplitude

play07:05

is three so we need to

play07:07

vary the sine graph or rather the cosine

play07:09

graph from negative three to three

play07:12

so cosine typically starts at the top

play07:15

but we have negative cosine so it's

play07:17

going to start from the bottom

play07:19

then it's going to go to the middle

play07:22

to the top

play07:23

back to the middle and then back to the

play07:24

bottom

play07:31

so that's how we can graph

play07:33

one cycle of negative three cosine x

play07:38

now keep in mind this graph can keep on

play07:40

going forever

play07:41

in both directions

play07:43

so let's say if we want to write the

play07:45

domain and range

play07:47

of this cosine graph

play07:49

the domain for sine and cosine graphs

play07:51

will always be the same it's all real

play07:53

numbers

play07:54

the range is based on the amplitude the

play07:58

lowest y value is negative three the

play08:00

highest y value is three

play08:02

so that's how you can write the domain

play08:04

and range of this particular cosine

play08:07

graph

play08:10

now let's talk about finding the period

play08:14

so given this

play08:16

sine function a sine b x we know a

play08:19

represents the amplitude

play08:21

now b

play08:22

is not the period itself

play08:24

but it's used to find the period

play08:27

the period is two pi

play08:29

divided by b

play08:30

so in the case of sine x

play08:33

b was equal to one so the period was two

play08:36

pi

play08:37

divided by one

play08:39

now let's go ahead and graph these two

play08:41

functions

play08:42

sine x

play08:45

and sine 2x

play08:49

let's see

play08:50

what effect b has on a graph

play08:53

now we know the general shape of sine x

play08:56

it has a period of 2 pi

play09:00

and for the most part it looks like this

play09:04

now if b is equal to 2 in this example

play09:07

the period is going to be 2 pi divided

play09:10

by b

play09:11

so the period is pi

play09:14

so therefore it's going to do one full

play09:17

cycle

play09:20

in less time so to speak

play09:23

so what happens is the graph

play09:26

it shrinks

play09:28

horizontally

play09:30

so one full cycle occurs

play09:33

in one pi

play09:34

two cycles occur in two pi

play09:39

here's another example go ahead and

play09:41

graph

play09:42

this function two sine

play09:44

one half x

play09:46

so first we need to find the amplitude

play09:48

the amplitude is the number in front of

play09:50

sine that's two

play09:52

the period

play09:53

is two pi over b where b is the number

play09:55

in front of x so in this case is one

play09:57

half

play09:58

two pi divided by one half is four pi

play10:05

so this one is going to stretch

play10:06

horizontally

play10:08

the amplitude is 2

play10:11

and the period is 4 pi

play10:14

but we need to break it up into four

play10:15

intervals

play10:17

that's 1 pi 2 pi

play10:20

3 pi and 4 pi

play10:22

sine starts at the center then it goes

play10:24

up

play10:26

back to the middle

play10:27

down and then back to the middle

play10:33

so we're going to have a graph that

play10:34

looks like that

play10:35

so if you have a fraction what's going

play10:37

to happen is it's going to stretch

play10:39

horizontally

play10:41

let's try another example

play10:43

let's graph

play10:45

4 cosine

play10:49

pi x

play10:52

so first identify the amplitude and the

play10:54

period

play10:55

the amplitude is simply 4 in this

play10:58

example

play10:59

and a period is 2 pi over b

play11:02

in this case b

play11:04

is the number in front of x so b is pi

play11:07

2 pi divided by pi is 2.

play11:10

so that's the period in this example

play11:13

so let's go ahead and make a graph

play11:21

so the amplitude is four

play11:28

it's going to vary from four and

play11:29

negative four

play11:31

the period is two

play11:34

so two should be about here

play11:39

and we need to break it into four parts

play11:42

so this is one

play11:43

one half

play11:44

and then between one and two you add

play11:47

them up one plus two is three then

play11:49

you average it or you divide it by two

play11:50

so it's three over two

play11:52

so those are the four points of interest

play11:56

cosine starts at the top then it's going

play11:59

to go to the middle

play12:00

and then back to the bottom

play12:02

to the middle and to the top

play12:05

so we're going to have a graph that

play12:07

looks like this

play12:10

that's one cycle

play12:11

and if we wish to extend it to draw

play12:13

another cycle this is going to be three

play12:17

uh next one is 2.5 or five over two

play12:20

and then three plus four is seven but

play12:22

then divided by two so three point five

play12:24

is seven over two

play12:28

the next point is going to be at the

play12:29

middle and then back to the bottom

play12:32

back to the middle and then to the top

play12:38

and that's it

play12:40

so that's how you can graph 4 cosine pi

play12:42

x

play12:43

so when you find your period make sure

play12:45

you put that first on the x axis and

play12:47

then break it into four intervals

play12:50

now what is the domain and range of this

play12:52

function

play12:54

as you recall the domain for any sine or

play12:57

cosine wave is all real numbers

play13:00

the range

play13:01

is from negative four to four

play13:04

it's from the lowest y value to the

play13:06

highest y value

play13:09

now let's talk about what to do

play13:11

when there's a vertical shift

play13:13

let's say if we wish to graph sine

play13:15

x plus three

play13:18

so the vertical shift is three

play13:21

the amplitude

play13:22

is one

play13:25

so what you want to do first

play13:28

is you want to plot the vertical shift

play13:32

so at 3 i'm going to draw a horizontal

play13:34

line

play13:37

that's going to be the new center of the

play13:38

graph

play13:39

the amplitude is 1

play13:41

so

play13:42

sine

play13:43

is going to vary one unit higher than

play13:45

the midline and one unit lower than it

play13:47

so it's going to vary between two and

play13:49

four

play13:51

now we're still going to plot just one

play13:52

period

play13:54

so let's write our four key points

play13:58

sine starts at the top

play14:00

and then it goes to the middle

play14:03

actually i take that back sign starts at

play14:04

the middle

play14:05

and then it goes to the top and then

play14:07

back to the middle

play14:08

to the bottom and then back to the

play14:10

middle

play14:11

so this would be one sine wave

play14:13

so that's how you can graph sine x plus

play14:15

string

play14:17

let's try another example

play14:21

let's graph

play14:22

two periods

play14:25

of two cosine

play14:27

x

play14:32

minus one

play14:38

so this is going to be one cycle

play14:41

and two cycle

play14:42

but let's start with the first cycle

play14:46

so the midline is at negative one

play14:53

now the amplitude is two so we got to go

play14:56

up two units

play14:58

and down two units

play15:02

now cosine

play15:04

will start at the top

play15:06

and then it's going to go to the middle

play15:08

back to the bottom

play15:10

and vice versa

play15:12

now we need to plot one more cycle

play15:15

so this is pi

play15:17

and this is three pi

play15:20

so it's going to go back to the middle

play15:22

and then to the bottom

play15:23

back to the middle

play15:24

and to the top

play15:26

so that's how we can graph

play15:29

two cosine periods

play15:34

now what is the range for this graph

play15:37

notice the lowest y values at negative

play15:39

three but the highest is at one

play15:41

so the range

play15:43

is from negative three to one

play15:48

let's go ahead and graph this one

play15:50

negative three sine x

play15:52

plus four

play15:55

so feel free to pause the video actually

play15:57

let's also let's change it a bit

play16:00

let's make it one-third

play16:02

x plus four

play16:05

the majority of the graph will be above

play16:08

the x-axis

play16:16

so let's draw the center line at four

play16:18

first

play16:21

the amplitude is three so we're gonna

play16:23

have to go up three four plus three is

play16:25

seven

play16:26

and then down three starting from four

play16:28

four minus three is one

play16:30

so the range

play16:33

is going to be from one to seven

play16:36

now let's find the period we know the

play16:38

period is two pi divided by b

play16:41

and b is one third

play16:43

so it's two pi divided by one third

play16:46

so it's equal to six pi

play16:48

and let's break it into four points half

play16:50

of six pi is three pi

play16:52

half of three pi

play16:54

is three pi over two

play16:55

and if you multiply this number by three

play16:57

it will give us to this point which is

play17:00

nine pi over two

play17:03

now we know that sign starts at the

play17:05

center

play17:07

positive sign will go up initially but

play17:09

negative sign

play17:10

will go down

play17:12

and then it's going to go back to the

play17:13

middle

play17:14

and then to the top at 7

play17:16

and then back to the middle

play17:18

so that's how you can plot

play17:20

negative three

play17:22

sine one third x plus four

play17:27

now let's talk about how to graph this

play17:30

function

play17:31

sine x

play17:32

minus pi divided by two

play17:35

how can we do so

play17:38

so considering the generic formula a

play17:41

sine bx plus c

play17:45

plus d

play17:47

anytime there's a c value

play17:50

there's a phase shift

play17:52

which means that the graph is going to

play17:54

shift either to the right or to the left

play17:57

and so you want to find the phase shift

play17:58

because sine won't start at the origin

play18:00

in this case

play18:01

so to find the phase shift

play18:04

set the inside equal to zero and solve

play18:06

for x so when you set b x plus c equals

play18:09

to zero

play18:10

x is going to equal negative c divided

play18:12

by b

play18:13

and this is your phase shift that's

play18:14

where it starts on the x-axis

play18:23

so let's set x minus pi over two

play18:26

equal to zero so we can see x

play18:29

is at pi over two so that's where the

play18:31

sine wave is going to start

play18:35

now let's go ahead and graph it

play18:37

the amplitude is one and the period is

play18:40

two pi over one so it's two pi

play18:42

but first plot

play18:44

pi over two

play18:47

because that's where the phase shift is

play18:49

and then what you want to do is

play18:51

add one period to the phase shift

play18:53

so you're adding two pi to pi over two

play18:56

two pi is the same as four pi over two

play18:58

so this will give you

play19:00

five pi over two

play19:06

so this is going to be three pi over two

play19:08

and you want to break it into five key

play19:10

points

play19:11

this is one pi over two in between one

play19:13

and three is two two pi over two is pi

play19:16

in between three pi over two and five pi

play19:18

over two we have four pi over two which

play19:22

reduces to two pi

play19:29

now the amplitude is 1 so it's going to

play19:31

vary from 1

play19:32

and negative 1.

play19:34

now sine starts at the middle but we're

play19:37

not going to start at the origin

play19:39

in this example we're going to start at

play19:41

the phase shift which is pi over 2.

play19:43

positive sign

play19:44

is going to go up negative sign is going

play19:46

to go down first so negative sign will

play19:48

be like this

play19:49

positive sign will have that shape

play19:53

and then at 2 pi it's going to have a y

play19:55

value of negative 1 and that 5 pi over 2

play19:57

is going to be back

play19:59

on the x axis

play20:00

so that's how you can plot this

play20:02

particular sine wave

play20:03

with a phase shift

play20:07

now let's try another example let's say

play20:09

if you want to plot 2

play20:12

sine x

play20:15

minus pi over 4

play20:19

plus

play20:21

three

play20:23

so we have a vertical shift of three an

play20:26

amplitude of two

play20:28

the number in front of x is one so two

play20:30

pi over one is two pi the period is

play20:31

still two pi

play20:33

but we do have a phase shift

play20:35

so if we set the inside equal to zero

play20:37

the phase shift is positive pi over four

play20:41

the majority of the graph will be above

play20:42

the x axis so

play20:44

we're going to plot it up there

play20:46

so let's plot the

play20:48

midline first

play20:49

or the center line

play20:52

which is at three

play20:53

the amplitude is two

play20:55

so we need to travel through two units

play20:57

above the center line which will take us

play20:59

to five three plus two is five and then

play21:01

two units down three minus two is one

play21:05

so the graph is going to vary from one

play21:06

to five and that's the range

play21:09

of this sine function

play21:12

now the phase shift is going to start at

play21:13

pi

play21:15

over four that's where the sine wave is

play21:16

going to start

play21:18

and if we add one period to that the

play21:21

period is two pi

play21:23

two pi over one is the same as a pi over

play21:25

four we need to get common denominators

play21:28

so if we add these two numbers this will

play21:30

give us nine pi over four

play21:36

so that's where the first period will

play21:38

end

play21:42

the midpoint between one and nine is

play21:44

five

play21:45

and the midpoint between one and five is

play21:47

three

play21:49

and between five and nine is seven

play21:55

now we can graph it

play21:58

so let's start with the phase shift sine

play22:01

is going to start at the middle

play22:03

and then it's going to go up

play22:05

back to the middle

play22:07

and then down and then back to the

play22:08

middle

play22:10

so this is the graph of just one period

play22:35

you

Rate This

5.0 / 5 (0 votes)

Étiquettes Connexes
TrigonometryGraphingSine WaveCosine WaveAmplitudePeriodPhase ShiftMath TutorialEducational ContentTrig Functions
Besoin d'un résumé en anglais ?