Program Linear (Part 1) Pertidaksamaan Linear Dua Variabel
Summary
TLDRThis educational video script introduces linear programming for high school students, focusing on two-variable linear inequalities. It explains the general form of such inequalities and demonstrates how to graph them by finding intercepts and connecting points. The script also guides viewers on determining the solution region by testing points against the inequality, emphasizing the importance of identifying the correct area that satisfies the condition. The lesson aims to equip students with the skills to solve practical problems related to linear programming in various fields.
Takeaways
- 📚 The lesson is focused on teaching linear programming for 11th-grade high school students, emphasizing its importance in various fields such as the garment industry and trade.
- 🔍 The script introduces linear equations with two variables, building upon the understanding of linear equations with one variable from the 10th grade.
- 📈 The general form of a linear equation with two variables is presented as 'Ax + By = C', where the sign can vary, including 'greater than', 'less than', or 'equal to'.
- 📝 The process of finding the solution set for a linear equation with two variables involves graphing the equation and identifying the intersection points with the coordinate axes.
- 📍 To graph a line, the script explains how to find the x-intercept by setting y to zero and solving for x, and the y-intercept by setting x to zero and solving for y.
- 📉 The script provides a step-by-step method to determine the solution area of a linear equation, starting with graphing the line and then testing points to see if they satisfy the inequality.
- 🚫 The importance of correctly identifying the solution area is stressed, with the script explaining how to eliminate areas that do not satisfy the inequality.
- 📐 The script uses examples to illustrate the process, including how to handle different types of inequalities and how to interpret the results of the tests.
- 🔎 The method of testing a point, such as the origin (0,0), is highlighted to determine whether it lies above or below the line, which helps in identifying the correct solution area.
- ✂️ The script emphasizes the practical application of linear programming, suggesting that the students should practice at home to better understand the concepts.
- 🌟 The lesson concludes with a reminder of the usefulness of linear programming and a wish for the students to benefit from the knowledge, ending with a respectful sign-off.
Q & A
What is the main topic of the video script?
-The main topic of the video script is the study of linear programming for 11th-grade high school mathematics, focusing on linear inequalities with two variables.
What is the significance of learning linear programming in various fields?
-Linear programming is significant in various fields such as the garment industry, trade, and others because it is widely applicable in solving real-life problems.
What is the general form of a linear inequality with two variables?
-The general form of a linear inequality with two variables is \( Ax + By \neq C \), where \( A \), \( B \), and \( C \) are constants, and the inequality sign can be 'not equal to', 'greater than', 'less than', 'greater than or equal to', 'less than or equal to'.
How do you find the intersection points of a line with the x-axis?
-To find the intersection point with the x-axis, set \( y = 0 \) and solve for \( x \) from the equation of the line.
How do you find the intersection points of a line with the y-axis?
-To find the intersection point with the y-axis, set \( x = 0 \) and solve for \( y \) from the equation of the line.
What is the first step in solving a system of linear inequalities?
-The first step in solving a system of linear inequalities is to graph the lines representing each inequality on a coordinate plane.
How do you determine the solution region for a linear inequality?
-The solution region is determined by testing a point, such as the origin (0,0), in the inequalities to see if it satisfies the condition of the inequality.
Why is it important to identify the area that is not part of the solution set?
-Identifying the area that is not part of the solution set helps in simplifying the process of finding the actual solution region and avoids confusion when dealing with multiple inequalities.
What is the process of eliminating non-solution areas in the context of the script?
-The process involves testing points in the inequalities and eliminating the areas that do not satisfy the inequality conditions, thus narrowing down to the actual solution region.
Can you provide an example of a linear inequality with a negative inequality sign as mentioned in the script?
-An example of a linear inequality with a negative inequality sign is \( 4x - 3y \leq 12 \), which represents a situation where the value of the expression on the left must be less than or equal to 12.
What does the script suggest for the final step in determining the solution region of a system of linear inequalities?
-The final step suggested in the script is to eliminate the areas that do not satisfy the inequalities, leaving behind the actual solution region where all conditions are met.
Outlines

Cette section est réservée aux utilisateurs payants. Améliorez votre compte pour accéder à cette section.
Améliorer maintenantMindmap

Cette section est réservée aux utilisateurs payants. Améliorez votre compte pour accéder à cette section.
Améliorer maintenantKeywords

Cette section est réservée aux utilisateurs payants. Améliorez votre compte pour accéder à cette section.
Améliorer maintenantHighlights

Cette section est réservée aux utilisateurs payants. Améliorez votre compte pour accéder à cette section.
Améliorer maintenantTranscripts

Cette section est réservée aux utilisateurs payants. Améliorez votre compte pour accéder à cette section.
Améliorer maintenantVoir Plus de Vidéos Connexes

CARA MENGGAMBAR GRAFIK PERSAMAAN GARIS LURUS‼️
Matematika Kelas 8 Bab 3 Persamaan Linier Satu Variabel - hal. 109 - 111 - Kurikulum Merdeka

Menentukan Nilai Optimum Menggunakan Metode Uji Titik Sudut (Uji Titik Pojok)
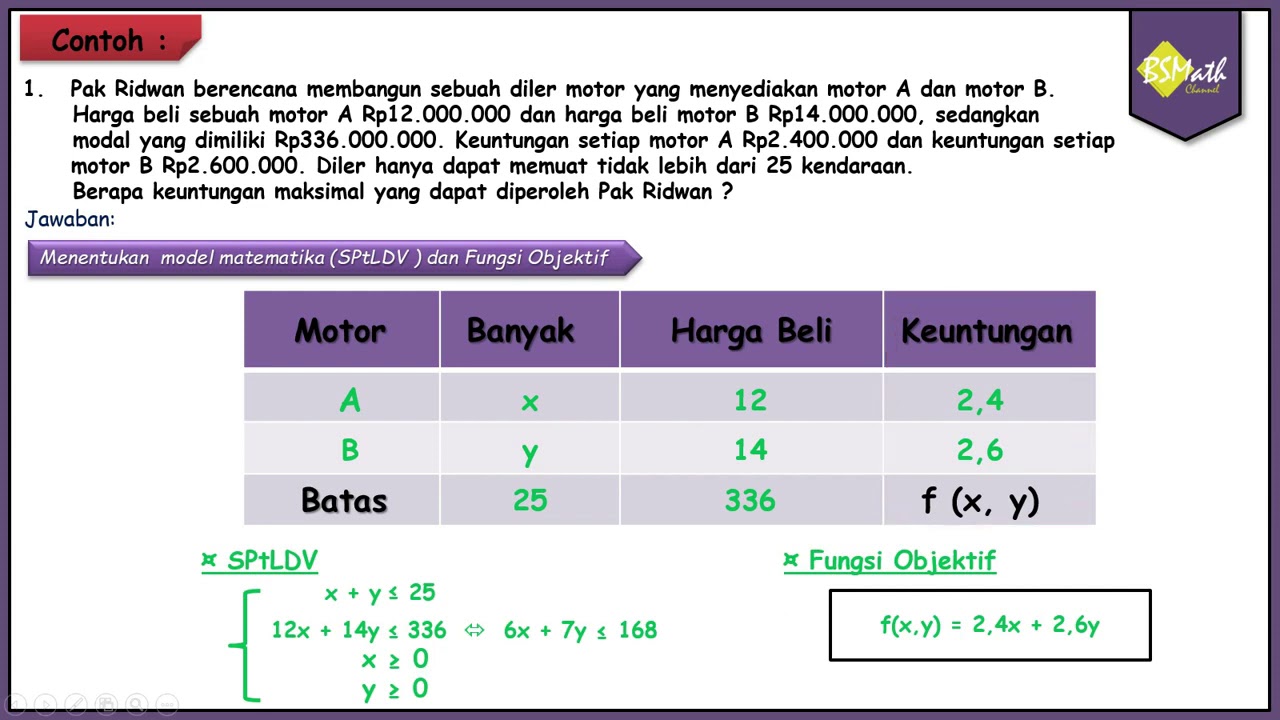
Menyelesaikan Permasalahan Program Linear Menentukan Nilai Optimum dengan Metode Uji Titik Pojok

Program Linear: 1.Menentukan grafik pertidaksamaan linear satu variabel

Kurikulum Merdeka Matematika Kelas 8 Bab 3 Persamaan dan Pertidaksamaan Linier Satu Variabel
5.0 / 5 (0 votes)
