UV Vis spectroscopy explained lecture

Shomu's Biology
1 May 201725:05

Summary

TLDRThis video tutorial from 'Somos Biology' delves into the fundamentals of UV-Visible spectroscopy, a technique widely used in chemistry and life sciences for determining the concentration of molecules in solutions. The script explains the setup of a spectrophotometer, the molecular mechanism behind light absorption, and how this technique can provide insights into chemical groups present in molecules. It also discusses the importance of 'lambda max' for identifying maximum absorbance and the use of the Beer-Lambert law for calculating unknown concentrations, making complex scientific concepts accessible to viewers.

Takeaways

  • 🌟 UV-Visible spectroscopy is a widely used technique in both chemistry and life sciences for various experiments and analyses.
  • 🔍 It is primarily used for determining the concentration of different substances or molecules in a solution, including cells in microbiology practicals.
  • 📈 The technique can also provide some information about the chemical groups present in molecules, though the data is not highly reliable for differentiating between different types of groups.
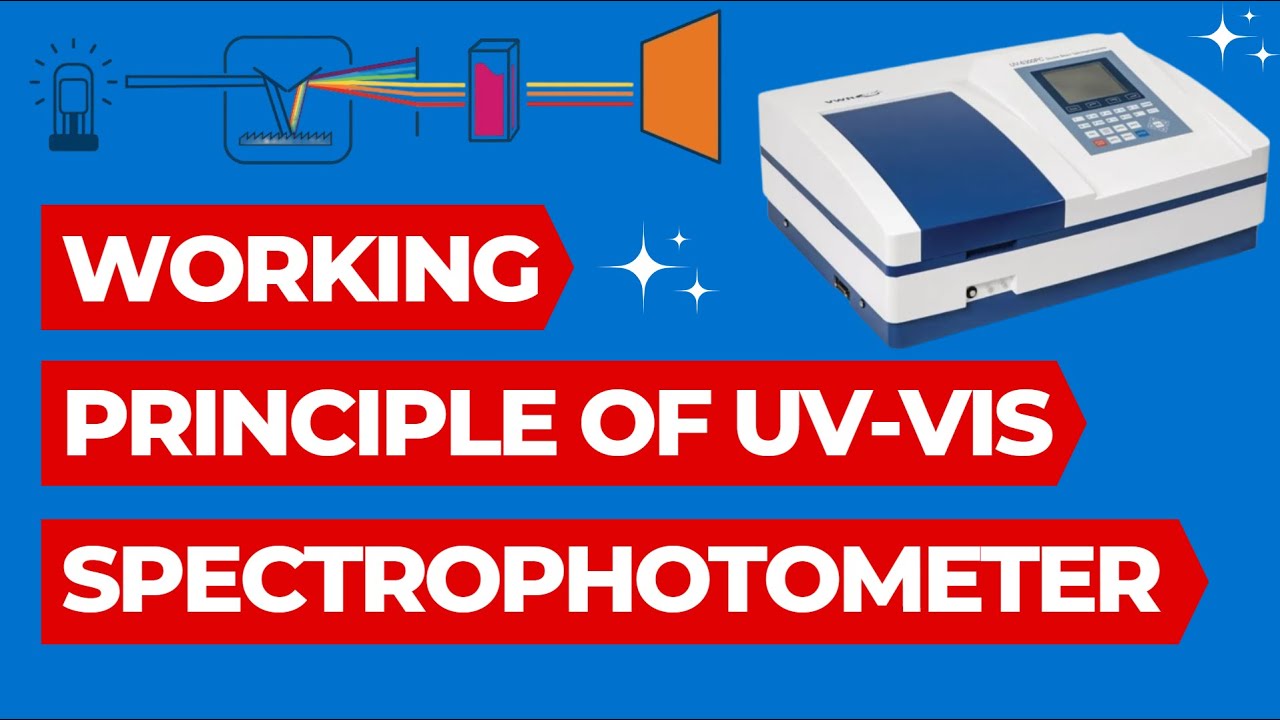
  • 🛠️ The setup of a UV-Visible spectrophotometer includes a light source, a monochromator to separate light wavelengths, a beam separator, and a detector to measure light intensity.
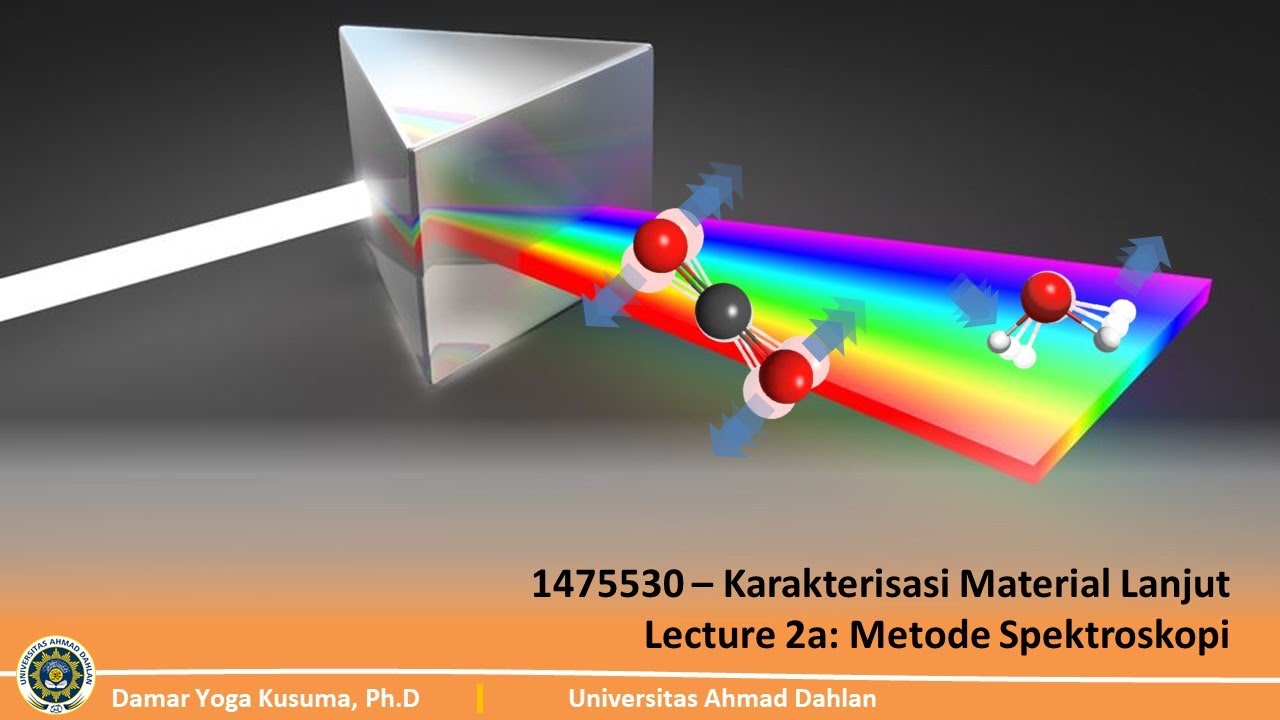
  • 🌈 The UV-Visible range of the electromagnetic spectrum is from 200 to 800 nanometers, with UV ranging from 200 to 400 nm and visible light from 400 to 800 nm.
  • 🔬 The molecular mechanism involves the absorption of light energy by molecules, causing electrons to jump from a ground state to a higher energy state, which is specific to certain wavelengths.
  • 📊 Beer-Lambert Law is used to relate the absorbance of light to the concentration of a molecule in a solution, which is crucial for quantitative analysis.
  • 📉 A plot of absorbance against concentration typically results in a non-linear curve, which can be linearized by using a logarithmic scale to facilitate easier calculation of unknown concentrations.
  • 📚 Understanding the specific wavelength (lambda max) at which a molecule absorbs light most strongly is important for identifying the maximum absorbance for different chemical groups.
  • 🔬 The molecular level process of UV-Visible spectroscopy involves the excitation of electrons from bonding or non-bonding orbitals to higher energy states, such as sigma or pi orbitals.
  • 👍 The video concludes by emphasizing the importance of UV-Visible spectroscopy for concentration analysis and its limitations in identifying specific chemical bonds.

Q & A

  • What is UV-visible spectroscopy and why is it used?

    -UV-visible spectroscopy is a technique widely used in chemical and life sciences to measure the concentration of different substances in a solution. It is also used to identify chemical groups present in molecules, although the data is not highly reliable for differentiating between different groups.

  • What are the main applications of UV-visible spectroscopy?

    -UV-visible spectroscopy is used for determining the concentration of molecules in a solution, including in microbiology for measuring cell concentrations. It is also used in enzymatic reactions and enzyme kinetic studies to assess enzyme-associated activities.

  • How does the UV-visible spectrophotometry work?

    -UV-visible spectrophotometry works by passing light through a sample and measuring the intensity of the light that is transmitted through it. The difference in intensity before and after the sample is used to calculate the absorbance, which is related to the concentration of the molecules in the sample.

  • What is the role of a monochromator in UV-visible spectroscopy?

    -A monochromator is a device that separates the light from a source into its different wavelengths. It allows only a specific wavelength of light to pass through, which is then used to analyze the sample.

  • What is the significance of the wavelength in UV-visible spectroscopy?

    -The wavelength is significant because different molecules absorb different wavelengths of light. By knowing the specific wavelength that a molecule absorbs, one can identify the presence of certain chemical groups within the molecule.

  • What is the relationship between frequency, wavelength, and energy of an electromagnetic wave?

    -The frequency and energy of an electromagnetic wave are directly proportional; higher frequency means higher energy. The wavelength and frequency are inversely proportional; shorter wavelength means higher frequency and vice versa.

  • How is the concentration of a molecule in a solution determined using UV-visible spectroscopy?

    -The concentration is determined by measuring the absorbance of the sample at a specific wavelength. Using the Beer-Lambert Law, which states that absorbance is proportional to the concentration of the molecule, the concentration can be calculated.

  • What is meant by 'transmittance' in the context of UV-visible spectroscopy?

    -Transmittance is the ratio of the intensity of light after passing through the sample (I) to the initial intensity of light (I0). It indicates the amount of light that has been transmitted through the sample.

  • What is the difference between transmittance and absorbance?

    -Transmittance measures the amount of light that passes through the sample, while absorbance measures the amount of light that is absorbed by the sample. They are inversely related; higher transmittance means lower absorbance and vice versa.

  • Why is it difficult to extrapolate data from a graph of percent transmittance versus concentration?

    -It is difficult because the relationship between percent transmittance and concentration is not linear, making it challenging to predict the concentration of unknown samples from such a graph.

  • How can a graph of absorbance versus concentration be made linear for easier data interpretation?

    -By plotting the logarithm of the concentration (or the reciprocal of transmittance) against absorbance, the graph becomes linear, which simplifies the process of extrapolating the concentration of unknown samples.

  • What is the molecular mechanism behind the absorption of light in UV-visible spectroscopy?

    -The molecular mechanism involves the excitation of electrons within molecules from a lower energy state (ground state) to a higher energy state when they absorb energy from light of a specific wavelength. The energy absorbed corresponds to the difference in energy levels between the molecular orbitals.

  • Why are UV-visible spectra not reliable for identifying specific chemical bonds?

    -UV-visible spectra are not reliable for identifying specific chemical bonds because many molecules with similar bonds and structures absorb light at similar wavelengths, making it difficult to distinguish between them based on UV-visible spectroscopy alone.

Outlines

00:00

🔬 Introduction to UV-Visible Spectroscopy

The video begins with an introduction to UV-Visible spectroscopy, a widely used technique in chemistry and life sciences for determining the concentration of molecules in a solution. The speaker explains that while this technique can provide some information about the chemical groups present in a molecule, it is primarily used for concentration analysis due to the reliability of its data. The video promises to delve into the setup, mechanism, and application of UV-Visible spectroscopy, including its use in colorimetry and enzymatic reactions.

05:01

🌟 Understanding the Setup of UV-Visible Spectrophotometry

This paragraph explains the basic setup of a UV-Visible spectrophotometer, starting with a light source that emits UV or visible light. A monochromator is used to separate the light into its individual wavelengths, creating a monochromatic beam. The beam separator directs this light towards two chambers, one for a control sample and one for the actual sample. The differences in light absorption between the two samples are then detected and recorded. The explanation includes the importance of wavelength and frequency in the context of the electromagnetic spectrum and how they relate to the energy of the light used in the technique.

10:03

📈 The Molecular Mechanism of UV-Visible Spectroscopy

The speaker describes the molecular mechanism behind UV-Visible spectroscopy, focusing on how molecules absorb specific wavelengths of light, causing electrons to jump from a ground state to a higher energy state. This absorption of energy results in a decrease in light intensity, which is measured by a detector. The concept of transmittance and absorbance is introduced, with the former being the ratio of light intensity after passing through a sample to the initial light intensity, and the latter being a measure of how much light is absorbed by the sample. The paragraph also touches on the importance of lambda max, the wavelength at which a molecule absorbs light most strongly.

15:04

📊 Data Interpretation in UV-Visible Spectroscopy

This section discusses how to interpret the data obtained from UV-Visible spectroscopy. The speaker explains the relationship between transmittance, absorbance, and concentration, and how a graph plotting absorbance against concentration can be used to determine the concentration of an unknown sample. The paragraph emphasizes the importance of using absorbance rather than transmittance for creating a linear graph, which facilitates the calculation of unknown concentrations. The explanation includes the Beer-Lambert Law, which quantifies the relationship between absorbance, the molar absorption coefficient, concentration, and path length.

20:07

🧬 Molecular-Level Understanding and Practical Application

The final paragraph delves into the molecular-level understanding of why molecules absorb light at specific wavelengths, discussing the energy states of different chemical bonds and how the energy from light is absorbed to excite electrons to higher energy states. The speaker also explains the limitations of UV-Visible spectroscopy in identifying specific chemical groups due to the similarities in the absorbance patterns of different molecules. The paragraph concludes with a reminder of the technique's primary use for concentration analysis and a call to action for viewers to like, share, and subscribe for more educational content.

Mindmap

Keywords

💡UV Visible Spectroscopy

UV Visible Spectroscopy is a technique used to analyze the interaction between light in the ultraviolet and visible range with chemical compounds. It is central to the video's theme as it is the main subject being discussed. The script explains how this technique is widely used in chemistry and life sciences to determine the concentration of molecules in a solution, with examples including the measurement of protein concentration and enzymatic activity.

💡Concentration Analysis

Concentration Analysis refers to the process of determining the amount of a particular substance in a given volume of solution. It is a key concept in the video, as UV visible spectroscopy is often used for this purpose. The script mentions that this technique can measure the concentration of different molecules in a solution, including cells during microbiology practicals.

💡Molecular Mechanism

Molecular Mechanism describes the process by which molecules interact with light at the molecular level during spectroscopic analysis. The script explains that when a molecule absorbs light at a specific wavelength, its electrons are excited from a lower energy state to a higher one, which is fundamental to understanding how UV visible spectroscopy works.

💡Monochromator

A Monochromator is a device that separates light of different wavelengths into a single beam of a specific wavelength. In the context of the video, it is part of the spectrophotometer setup, which is crucial for UV visible spectroscopy. The script describes how the monochromator uses a prism to separate light into its different colors and allows only one specific wavelength to pass through at a time.

💡Beam Separator

A Beam Separator is a component in a spectrophotometer that directs the monochromatic light into separate paths for control and sample measurements. The script mentions the beam separator in the context of the spectrophotometer setup, explaining that it guides the light to two different chambers, one for the control and one for the sample.

💡Detector

A Detector in the context of spectroscopy is a device that measures the intensity of light after it has passed through the sample. The script explains the role of the detector in recording the data that ultimately provides information about the concentration of molecules in the sample.

💡Transmittance

Transmittance is the ratio of the intensity of light that passes through a sample to the intensity of incident light. It is a key concept in the script, as it is used to calculate the absorbance and thus determine the concentration of the sample. The script explains that transmittance is inversely related to absorbance and is measured by the detector.

💡Absorbance

Absorbance is a measure of how much light is absorbed by a molecule at a specific wavelength. It is directly related to the concentration of the molecules in the sample. The script discusses how absorbance is calculated from transmittance and used to determine the concentration of unknown samples by comparing it to a standard curve.

💡Lambda Max (λmax)

Lambda Max (λmax) is the wavelength at which a molecule absorbs light most strongly. The script explains that each type of chemical group has a specific λmax, which can be used to identify the presence of certain groups in a molecule, although it is not a definitive method for determining specific chemical bonds.

💡Molar Absorption Coefficient (Epsilon)

The Molar Absorption Coefficient, often denoted as epsilon (ε), is a constant that relates the absorbance of light by a molecule to its concentration and the path length of the light through the sample. The script discusses how this coefficient is used in the Beer-Lambert Law to calculate the concentration of an unknown sample from its absorbance.

💡Beer-Lambert Law

The Beer-Lambert Law, also known as Beer's Law, describes the relationship between the absorbance of a solution and the concentration of the absorbing molecules. The script explains that this law is fundamental to UV visible spectroscopy, allowing for the calculation of the concentration of unknown samples based on their absorbance.

Highlights

UV visible spectroscopy is widely used in chemical and life sciences for various experiments.

The technique helps in determining the concentration of different molecules in a solution.

UV visible spectroscopy can also measure the concentration of cells in microbiology practicals.

The technique provides limited information on the chemical groups present in molecules.

The video explains the setup of UV visible spectrometry, starting with a light source.

A monochromator is used to separate different wavelengths of light into a single beam.

The role of a beam separator in directing light to control and sample chambers is discussed.

The detector measures the intensity of transmitted light, which is key to determining concentration.

The molecular mechanism involves electrons absorbing energy and jumping to higher energy states.

Sigma and pi bonds require different amounts of energy for electron excitation.

The video explains the concept of transmittance and absorbance in the context of spectroscopy.

Lambda Max is identified as the maximum wavelength for which absorbance is the highest.

The Beer-Lambert Law is used to relate the concentration of a molecule to its absorbance.

A graph of absorbance versus concentration can help determine the concentration of unknown samples.

The video demonstrates the process of creating a calibration curve for concentration analysis.

UV visible spectroscopy is not used for identifying specific chemical bonds due to limitations.

The video concludes by summarizing the practical applications and limitations of UV visible spectroscopy.

Transcripts

play00:03

[Music]

play00:10

welcome back friends welcome to another

play00:12

video tutorial from somos biology and in

play00:15

this video tutorial we want to talk

play00:17

about UV visible spectroscopy I've got a

play00:20

request from many of my subscribers to

play00:22

make a video on that previously made

play00:24

video on IR spectroscopy and extra NMR

play00:27

spectroscopy so if you want to know

play00:30

about NMR and IR spectroscopy you can

play00:32

look at my channel and you will get

play00:34

videos on that so let's begin with UV

play00:36

visible spectroscopy UV visible

play00:38

spectroscopy is very widely used

play00:41

technique in not only chemical or

play00:43

chemistry labs but also in life sciences

play00:45

many different experiments to rely on

play00:47

the idea of UV visible spectroscopy but

play00:50

the first question is why we need this

play00:53

technique if it's a technique then what

play00:55

this technique is giving us the answer

play00:58

to that is in many situation we need to

play01:00

find concentrations of different

play01:02

substances concentration of different

play01:04

molecules in a solution and that we can

play01:07

measure perfectly with UV visible

play01:10

spectroscopy and in some cases also

play01:13

concentration of cells during the

play01:15

microbiology practicals we can also use

play01:17

UV visible spectroscopy to measure so it

play01:20

can give us a good data about the

play01:23

concentration of any molecule that is

play01:25

present in a solution but it also can

play01:28

tell us a little bit about the chemical

play01:31

group that is present in the molecule

play01:33

but the data that we get is not very

play01:36

much reliable because for the different

play01:38

types of group the UV visible

play01:40

spectroscopy can give us very similar

play01:42

data so you generally use it for only

play01:44

concentration analysis but how exactly

play01:46

we will get to know the concentration

play01:48

from the UV visible spectrophotometry

play01:51

let's look at that in this video to

play01:54

understand using visible spectrometry we

play01:56

also tagged it with known as the

play01:58

colorimetry which is linked something

play02:00

with the different colors of the color

play02:02

substances which can help us to identify

play02:04

the concentration of the colored

play02:07

compound that is present in there and we

play02:09

use it extensively in enzymatic

play02:10

reactions to find out enzyme

play02:12

associated activities an enzyme kinetic

play02:15

studies so the first thing that will

play02:18

tell you is what easy visible

play02:20

spectroscopy and how the whole technique

play02:22

is oriented like how the mechanic the

play02:25

mechanism of the technique so all these

play02:26

instruments that are present there to

play02:28

make this technique possible then I'll

play02:30

tell you the molecular mechanism with

play02:32

which this whole technique works so

play02:34

let's begin with the actual setup of

play02:36

this UV visible spectrometry and that

play02:38

gives us start with a source that you've

play02:41

definitely a light source because as we

play02:44

see UV visible spectrometry utilizes UV

play02:48

or visible range of light as the energy

play02:52

source primary energy source to to find

play02:55

out the important feature of

play02:57

concentration in case of is spectrometry

play02:59

we know that infrared is the range of

play03:01

the light that they've used but in this

play03:03

case we use UV or visible range and you

play03:06

know UV and visible range like

play03:08

electromagnetic range you should have a

play03:10

little idea about the electromagnetic

play03:12

wavelength that we see completely and

play03:14

some basic idea before talking into the

play03:16

details is if you look at the

play03:18

electromagnetic spectrum you will find

play03:20

out different wavelengths it's ranging

play03:22

from like gamma rays to ultimately

play03:25

ending there in the microwave as well as

play03:28

infrared waves till the end so what

play03:30

those different waves are telling us the

play03:32

important feature you always need to

play03:34

know is the idea of two things one is

play03:36

the wavelength and the frequency of that

play03:39

electromagnetic wave the more the

play03:42

frequency of a wave the higher energetic

play03:44

that wave is that energy is that's idea

play03:47

more frequency more energy and if you

play03:51

have more frequency the wavelength will

play03:53

be long I mean so the less sorry more

play03:57

frequency less wavelength higher energy

play03:59

and less energy means less frequency and

play04:03

longer wavelength so very long

play04:06

wavelength that will give you less

play04:08

frequency and less energy higher like

play04:11

shorter wavelength more frequency more

play04:13

energy so in this case if we divide this

play04:16

UV visible spectrum into the small part

play04:19

and fractions what we'll find here is

play04:21

simply ranging me from

play04:24

200 to 800 that's kind of the range

play04:26

although we have we can extend it till

play04:28

10 20 nanometer in the wavelength but

play04:32

from 200 nanometer to 800 nanometer that

play04:35

will be the range from 200 to 400

play04:37

approximately taken as a UV range and

play04:39

from 400 to 800 approximately taken here

play04:42

for the visible light range that we

play04:45

usually use for the UV visible

play04:46

spectrometry but normally actually UV

play04:49

range ranges even back less wavelength

play04:53

less number of nanometer of the

play04:57

wavelength till this part as well so

play04:59

what we know here by looking at the

play05:01

spectrum is that as we are going close

play05:03

to UV the wavelength is shorter so the

play05:06

frequency is higher as we going this

play05:10

side the frequency is low so this right

play05:12

hand side we find more like a like a

play05:15

microwave IR or infrared that means long

play05:20

wavelengths less energy less frequency

play05:23

till we get towards UB x-ray gamma ray

play05:28

that means very short wavelength and

play05:32

frequency is very very high energy also

play05:36

very very high this is the scheme now

play05:39

from this scheme you only take the 200

play05:41

nanometer to 800 nanometer range now in

play05:44

this case whenever we go to 400 to 800

play05:46

nanometer we have the visible range of

play05:48

the light that is visible colors that we

play05:51

know the big G or the color violet

play05:53

ultraviolet that from the from the

play05:55

violet till the red that is a different

play05:58

7 separate colors are ranging from this

play06:00

part of the visible range now what we do

play06:03

now is simply if you look at the no

play06:06

instruments it goes like the source okay

play06:09

so let any kind of light source a

play06:12

filament in there this is the light

play06:15

source and after the light source it has

play06:17

a separate unit known as a monochromator

play06:21

let me draw this unit this is mono

play06:24

chromatic what motor chromatid does is

play06:30

normally you know the source light as it

play06:32

will have visible and you arrange it

play06:34

have this this basic light that we know

play06:37

the law

play06:37

coming from the lightbulb and a

play06:39

headlight of your scooter so dancing 27

play06:43

separate all these different wavelengths

play06:44

so monochromator separates all those

play06:47

different wavelengths of the light into

play06:49

single beam that's why called mono

play06:52

chromatic because if we make single beam

play06:55

from all this mixture of this light and

play06:57

after the monochromator what else we

play07:00

have we have the beam separator and the

play07:04

beam separator almost like like almost

play07:06

what we can say simple norm which can

play07:09

separate the beam and guide it into two

play07:12

separate directions and in this two

play07:17

separate direction we have two separate

play07:22

chambers one is for the control and the

play07:28

sample chamber and then right after both

play07:32

this chamber both the chambers are

play07:34

connected to a detector this is the

play07:41

simplest drawing of any individual

play07:45

spectrophotometer and it begins with the

play07:48

with the source and the source light

play07:52

comes in and here we have small small

play07:54

gap slits through which the light passes

play07:56

after passing there there will be this

play07:59

this mirrors will reflect it but

play08:01

ultimately there is a prism inside this

play08:04

monochromator so this is prism so I have

play08:08

this prism this prism will separate

play08:10

those that light into all these

play08:14

different types all these different

play08:17

wavelength of the light different color

play08:19

so only one specific wavelength will be

play08:21

allowed to pass through this ultimate

play08:23

chain now you can alter this like

play08:25

anytime you can pass a red light you can

play08:28

pass blue it can pass orange except a

play08:30

scalar depends on in which angle are the

play08:33

the channel is present through which if

play08:36

we go to this beam separator and the

play08:37

beam separator will separate the same

play08:39

monochromatic light send it to two

play08:42

chambers the Chamber's with the control

play08:45

and the Chamber's with the sample and

play08:47

then from both this they will get the

play08:50

data

play08:51

detector detection by the detector and

play08:52

then finally they will record the data

play08:54

and give you the answer to it now the

play08:57

question is in the simplest structure

play09:01

that we see why this kind of structure

play09:04

is paper and what exactly our role in

play09:06

this case the idea of UV visible

play09:08

spectrometry is simply whenever the

play09:11

light hits a specific wavelength of

play09:13

light hits a molecule that molecule get

play09:17

excited and the electron once excited is

play09:21

jumped up from a lower or we can say

play09:24

ground state to a higher energy state

play09:26

and whenever the electron jumps out what

play09:28

it does is absorb that particular light

play09:31

energy because the electron utilizes

play09:33

that energy to move from the ground

play09:35

state to the top state right because you

play09:38

know one thing all your light is that

play09:40

energy cannot be created it cannot be

play09:42

destroyed the only thing possible is

play09:45

transforming energy from one form to the

play09:48

other so in this case getting the energy

play09:49

so energy is little bit absorbed at that

play09:51

point energy is utilized at this point

play09:54

is in a more scientific way so what we

play09:56

know if the energy is utilized then what

play09:59

we know the intensity of that light that

play10:02

received is lost a little bit right so

play10:07

what we know if we put a blank a little

play10:10

cubic qubit are small chambers where we

play10:14

add samples to date so generally they

play10:16

are made a bit glass so this Gloves

play10:18

cubed is present here and in this qubit

play10:20

we only put water so there is no

play10:22

molecules present there or nothing is

play10:24

very completely basic water so what

play10:27

happens that light beam passing through

play10:28

water and water there is no molecule to

play10:31

finally absorb any light or utilizing

play10:33

the energy from the light so what it

play10:35

does simply it usually passing almost

play10:38

the same intensity that ultimately

play10:41

reaches here so what we get here there

play10:44

are two separate intensity that a

play10:45

detector always can measure in both the

play10:47

sku which we put water then what will

play10:49

happen

play10:50

same like that become so normally the

play10:53

light that generally come if there is no

play10:55

absorption known as the intensity of the

play10:58

light starts with i0 this is the start

play11:01

point of the intensity of the light

play11:03

then if you put the sample then we get

play11:06

another intensity depending upon the

play11:08

molecule that is present in that sample

play11:09

but here same so we also call it I

play11:13

because that's the intensity of the

play11:16

sample but in this case we know if you

play11:18

put water in both the chambers then we

play11:20

will get the value of i0 will be equal

play11:23

to I will be seen so the intensity of

play11:26

start and intensity at the end are same

play11:29

that means we're dealing with same

play11:31

solution and literally this solution is

play11:33

not taking any intensity that is first

play11:36

transmitted through this beam separator

play11:38

but now imagine in the sample tube in

play11:42

the sample chamber we put a qubit and

play11:44

here what we put a solution let the

play11:48

protein let's say put protein solution

play11:50

in there now proteins mainly there are

play11:53

bulky rings in the proteins and all

play11:55

those aromatic amino acids those amino

play11:58

acids will receive then we energy at a

play12:01

specific wavelength and if you also put

play12:03

DNA they will also be absorb a specific

play12:06

wavelength of light compared to the

play12:08

other like and that is also due to the

play12:10

bases that are present in the DNA so

play12:12

usually for proteins that we know that

play12:14

it will absorb the 260 nanometers of the

play12:17

wavelength so once you see the 250

play12:19

nanometer of the wavelength here and

play12:21

that causes absorption of that

play12:24

wavelength absorption of few of this

play12:26

energy by the number of protein

play12:29

molecules that are present there the

play12:30

amount of protein the concentration of

play12:32

protein that is present there the more

play12:34

proteins present there the more

play12:36

absorption and the less is this

play12:38

intensity of the incident and intensity

play12:42

of the of the reflected eye because you

play12:46

know light is passing reflected and

play12:47

finally reaching the detector so the

play12:50

more absorption there is I value will be

play12:52

decreased so in that case we know there

play12:55

is a net change in intensity and what we

play12:58

can find about the net change is this

play13:01

this is the net change in the intensity

play13:03

is it it so what we know here as as

play13:07

known as a transmittance transmittance

play13:11

known as the value for so we call it

play13:16

transmittance or capital T

play13:17

the value for I by i0 that is known as a

play13:21

transmittance so the more light is

play13:23

refracted the more light is removed

play13:26

that means the more transmission

play13:27

transmission take place and the less

play13:30

light is removed which is the value of I

play13:32

will be less the less transmittance is

play13:34

there so if we know the value of

play13:36

transmittance now what is about

play13:38

absorbance transmittance and absorbance

play13:41

are opposite to each other

play13:44

different to each other so transmittance

play13:46

is I by I 0 in that case absorbance will

play13:50

become a lot of value of i0 by I that's

play13:54

how you measure absorbance so more

play13:57

transmittance less absorbance less

play13:59

transmittance more absorbance and that's

play14:02

kind of a true and it depends on the

play14:04

concentration of the molecules that is

play14:07

present in the sample now what kind of

play14:09

molecule that is present there dictates

play14:11

also what kind of group chemical group

play14:13

is present also dictates at which

play14:15

wavelength they will receive the energy

play14:17

that is also very very important and for

play14:19

every single type of chemical groups

play14:21

there is a specific wavelength for which

play14:24

the absorbance is maximum known as a

play14:28

lambda Max or lambda maximum lambda max

play14:31

is the maximum wavelength for which they

play14:33

will give you most absorbance and the

play14:36

readings they're known as lambda max we

play14:38

can also get the value of lambda max for

play14:40

different types of chemical groups now

play14:42

the question is why we they absorb this

play14:47

light and how this process works

play14:49

molecular level we'll talk about that in

play14:51

a moment but before going in there let

play14:54

me first tell you how exactly we

play14:55

interpret this data because you know

play14:57

detector detects two things v-0 and I

play14:59

the difference between the two will tell

play15:02

you whether they will absorb some light

play15:04

or they transmitted more light so for

play15:07

that what we can find in this particular

play15:09

case is simply we can plot a data with

play15:13

the the absorbance and the difference in

play15:15

the absorbance by that percent like the

play15:19

difference of the absorbance along with

play15:21

the concentration so if you know one if

play15:23

you know if you know the absorbance we

play15:25

can also find the concentration

play15:27

there but how exactly because we know

play15:29

that the transmittance if we look

play15:30

normally in this data they are not going

play15:33

to give us absorbance as a value because

play15:36

the detector detects the transmittance

play15:38

right because the absorbance is there in

play15:40

the sample and detector only detects how

play15:43

much is transmitted how much transfers

play15:45

through this Q weight to the detector so

play15:47

always the value that we get will be in

play15:50

the transmittance form so simply what we

play15:52

can draw from here we can draw a graph

play15:54

and in that graph what we say the

play15:57

percent transmittance and also

play15:59

concentration of the solution of the

play16:02

molecule so transmittance will be almost

play16:04

the value of 10 to the power minus

play16:07

concentration into the length of the

play16:13

qubit that is the length of the qubit

play16:16

dictates also how and how many molecules

play16:18

of that molecule is present in that

play16:21

qubit so according to beer and Lombard

play16:24

they told us that P our transmittance

play16:29

can be measured in the form of 10 to the

play16:31

power minus concentration into the

play16:32

length but transmittance is not going to

play16:35

give us much data because if we put the

play16:38

data in the terms of transmitted wave

play16:39

let's say the concentration is very less

play16:41

transmission should be maximum right

play16:43

absorbance in that case will be very

play16:47

less so transmittance will be highest

play16:48

then let's elevate them a little bit

play16:50

more and more and more so what kind of

play16:53

graph we get we get a graph like this

play16:55

slope like this this is not a straight

play16:58

line this is not a linear drop now the

play17:01

problem with this graph is although we

play17:03

are getting the data directly from the

play17:05

detector as observed percent

play17:06

transmittance and the concentration it

play17:08

will be very difficult for us to

play17:10

extrapolate the data let's say we know

play17:12

samples and we utilize some case samples

play17:16

of the concentration which we know and

play17:18

we plotted the plot with it then what we

play17:21

do then we work an unknown and it

play17:24

tasting that unknown and somehow the

play17:26

unknowingly here here she becomes very

play17:29

difficult for us to finally calculate

play17:30

what exactly the concentration of that

play17:33

unknown it becomes really difficult but

play17:35

if the if the data is always straight

play17:38

line

play17:39

it becomes very easy to predict the

play17:41

concentration of any unknown sample and

play17:43

that's exactly what we do normally in

play17:46

lab if you are checking up a protein

play17:48

concentration we first prepare standard

play17:51

concentration of proteins that the

play17:53

concentration of which we already know

play17:55

and then what we do then we plot a data

play17:58

with it a straight line and then the

play18:01

unknown sample whenever we get the

play18:03

absorbance by putting in the data we can

play18:05

simply extrapolate the data to the

play18:07

concentration to find the actual

play18:08

concentration of that protein but how

play18:12

exactly we'd get a straight line in the

play18:15

curve that is a big problem and the only

play18:18

way is possible if we get the data in

play18:20

absorbance scaled because knowing

play18:22

absorbance scale the data should be

play18:25

something like that we'll start from

play18:26

local sensation low absorbance high

play18:28

concentration high absorbance and linear

play18:30

relation but the transmittance is not a

play18:33

linear relation so in this case to make

play18:36

it a linear relation of any curved line

play18:39

remember that in your lifetime you will

play18:41

always do a log

play18:43

so the log value of concentration in two

play18:51

lengths that can give you the value of

play18:54

absorbance that will give you the value

play18:57

of observers and the log value that we

play19:00

utilize here is simply utilizing as a

play19:02

constant that is known as molar

play19:05

absorption coefficient or epsilon into

play19:10

concentration into length we also can

play19:13

write it as epsilon concentration is

play19:16

written as C length is length of the

play19:18

cubed known as L so the formula comes

play19:20

down to epsilon C l equals absorbance

play19:25

this is the net absorbance formula ecl

play19:28

derived from lambert bier equation and

play19:31

from this equation what you can also

play19:33

tell if you know absorbance because in

play19:35

the experiments we can find absorbance

play19:38

so if you know absorbance you can find

play19:42

concentration so for a concentration it

play19:45

will be absorbance divided by epsilon

play19:48

into

play19:50

and this is how we can calculate a

play19:52

concentration of an unknown molecule

play19:55

unknown molecule that can be protein din

play19:57

or any other molecule out there by this

play20:00

fashion what we can create we can create

play20:02

a straight line of the graph we can

play20:06

trial of easily predict the

play20:09

concentration let's say this is the

play20:10

straight line of the graph and we know

play20:11

the unknown protein is sommore somehow

play20:14

represented and present someplace like

play20:16

here so the concentration is simply drag

play20:18

and we find it here and in that case

play20:20

instead of transmittance EDB absorbance

play20:23

so that's how you get the concentration

play20:26

value from the graph as well okay so

play20:29

this in a sense is the mechanism of how

play20:32

we use UV visible spectrometry and to

play20:35

get the data out of it but the second

play20:37

part is also left why and how it's

play20:40

working in the molecular level remember

play20:42

for all this type of molecules I told

play20:44

you it for all these different varieties

play20:46

of molecules there is only a specific

play20:49

wavelength for which that molecule will

play20:51

get some energy and absorb the energy

play20:53

and do some transmittance of the energy

play20:56

now what is that mechanism to understand

play21:00

that let me do some of this

play21:02

so what we know at this particular point

play21:05

is all those different different

play21:08

molecules of chemical groups like

play21:09

different bondings inside so for any

play21:14

molecule if we look at here it's simply

play21:16

we can divide in their energy states and

play21:20

energy state with that like the ground

play21:22

states like the nonbonding state or N

play21:25

and then we have pi PI star Sigma star

play21:32

Sigma this is almost like the simplest

play21:35

idea of how the energy states are looks

play21:39

like an atom in this particular case we

play21:41

have the Sigma Phi n which is a

play21:43

nonbonding and then five-spice turn and

play21:46

Sigma star these are also nonbonding but

play21:49

these are the bonding so the idea is we

play21:51

have carbon carbon this is a single bond

play21:53

present between carbon and carbon this

play21:55

is a PI bond so what happens normally

play21:57

here in this case of carbon

play21:59

sorry carbonyl carbon this is Sigma

play22:01

very sorry so have it's a sigma bond

play22:03

strong very much strong Sigma bond and

play22:06

Sigma bonds require more energy to

play22:07

create and break so here Sigma bond is

play22:10

there so so the electron that is present

play22:12

let's say here in this orbital here and

play22:15

the electron whenever the receives a

play22:18

specific energy it can jump up to the

play22:22

Sigma star so it will jump from one

play22:26

orbital to the other this is a ground

play22:27

state to the higher energy state but the

play22:30

problem is in the higher energy state

play22:32

the bond will not be very much stable so

play22:35

again you need to remove from that so

play22:37

this is how the electrons jump from a

play22:39

ground state to a higher energy state

play22:41

for a sigma bond directly from Sigma to

play22:44

Sigma star now they can also jump to

play22:49

this nonbonding orbital but if it takes

play22:51

only less energy

play22:52

similarly if it's C double bond o in

play22:56

that case we know this is a PI bond so

play22:59

for a pipe on the journey will begin

play23:01

from this PI and it will go to the PI

play23:04

star and from the PI to the in now it

play23:09

depends on how much energy available at

play23:11

what is the exact wavelength of light

play23:13

that's sitting that's why they rely on a

play23:17

specific wavelength for excitation for

play23:20

UV visible spectrum matrix always the

play23:22

excitation of that molecule in response

play23:25

to the energy that they receive in

play23:27

response to the wavelength of light

play23:28

that's hitting now if the wavelength of

play23:30

light is shorter that means very much

play23:33

high frequency high energy for a sigma

play23:37

bond it will directly jump to the Sigma

play23:38

star but for a PI bond if it's work for

play23:41

a very like a comparatively less energy

play23:44

it cannot push the electron to the PI

play23:47

from PI to PI star instead it will push

play23:48

from PI to the nonbonding orbital and

play23:51

that's how the whole thing's worked and

play23:53

based on that the absorbance also vary

play23:55

because the energy taken for the

play23:58

electron to jump from the ground state

play23:59

to the energy state is lost that's the

play24:01

energy which is absorbed rest of the

play24:03

energy is transmitted out that's how we

play24:06

find the transmittance okay so in a turn

play24:09

this is the idea from looking at this

play24:12

idea you can tell

play24:13

we kind of can bein able to get an idea

play24:16

about what kind of bonds that are

play24:18

present and what kind of chemical groups

play24:20

that are present in a molecule but in

play24:22

reality there are so many molecules with

play24:25

similar types of bonds and the same

play24:27

length same formula of those molecules

play24:29

you will be you cannot recognize we

play24:31

cannot recognize the exact group by

play24:34

looking at this technique that's why we

play24:35

don't use it to get an idea about the

play24:37

specific chemical bonds that are present

play24:40

which we use for NMR which we'll use for

play24:41

the a magnetic resonance spectroscopy as

play24:45

well as in case of is spectroscopy but

play24:47

not in case of UV visible you only keep

play24:50

you be visible or the process of

play24:52

concentration analysis of molecules okay

play24:55

so that's it if you liked this video

play24:57

please hit the like button and share

play24:58

this video with your friends and

play24:59

subscribe to my channel to get more and

play25:01

more videos like that thank you

Rate This

5.0 / 5 (0 votes)

Etiquetas Relacionadas
UV SpectroscopyVisible LightConcentration AnalysisMolecular BondsSpectrophotometryChemistry LabsLife SciencesAbsorbanceTransmittanceEnzyme Kinetics
¿Necesitas un resumen en inglés?