Monitor
Summary
TLDRThe script outlines the monitoring phase of an optimization process in a CCAI Insights console, highlighting various dashboards for tracking conversations, topics, and agent performance. It emphasizes the importance of monitoring metrics such as conversation volume, topic distribution, and customer satisfaction to improve call center operations. Users can filter data to analyze trends and agent efficiency, providing actionable insights for optimizing customer interactions.
Takeaways
- 📊 The CCAI Insights console provides various dashboards to monitor signals in the Optimization process, including Conversation hub and topic models.
- 🔍 Conversations created dashboard shows daily traffic through Insights, while Conversation history provides metrics like average duration and top topics.
- 📈 Topic models dashboard displays topic distribution over time, allowing for the identification of trends or less frequent topics.
- 🔑 Conversation highlights dashboard tracks the popularity of keywords or phrases, with options to view Smart Highlights or Custom Highlights.
- 🗣 Generative FAQ dashboard monitors customer questions and how they are answered by the agent, indicating question popularity and response efficiency.
- 📞 Call Center Operations dashboard in Looker offers an overview of metrics like call numbers, containment, and sentiment.
- 📈 The dashboard also includes metrics for customer segmentation, topic volume, and conversation volume to understand customer behavior and preferences.
- 🤖 Virtual Agent Performance dashboard, when integrated, assesses the performance of virtual agents against live agents for specific tasks.
- 👥 Agent Performance dashboard focuses on live agents, offering insights into waiting times, follow-up needs, and agent-specific metrics like CSAT.
- 📝 Detailed filters can be applied to any dashboard or graph to view more granular data, enhancing the monitoring process.
- 📊 Monitoring metrics such as conversation handling, call duration, sentiment, and customer ratings can be tailored to specific agents for performance analysis.
Q & A
What is the purpose of the Monitor phase in the Optimization process?
-The Monitor phase in the Optimization process is focused on tracking and analyzing various signals and metrics to assess the performance and effectiveness of the conversational AI system.
How can I view the number of conversations created per day in CCAI Insights console?
-You can view the number of conversations created per day through the 'Conversations created' dashboard in the Conversation hub of the CCAI Insights console.
What metrics are displayed in the Conversation history dashboard?
-The Conversation history dashboard displays high-level metrics such as the total number of conversations, their average duration, average turns per conversation, and the top three conversation topics.
How can I filter conversations by primary topic in the Conversation history dashboard?
-You can use filters in the Conversation history dashboard to get a list of conversations that share the same primary topic, allowing you to analyze metrics like the number of turns or the time of occurrence.
What information does the topic models dashboard provide?
-The topic models dashboard shows the distribution of topics over time, allowing you to identify spikes in specific topics or determine which topics receive the most or least amount of traffic.
How can I highlight specific topics in the topic models dashboard?
-By clicking on 'View Legend', you can open a sub-menu with a list of identified topics and select one or more topics to highlight their distribution in the graph.
What does the Conversation highlights dashboard monitor?
-The Conversation highlights dashboard monitors the popularity of keywords or key phrases in your conversational data, displaying each tracked phrase over time along with their count.
What is the purpose of the Generative FAQ dashboard in the CCAI Insights console?
-The Generative FAQ dashboard shows questions asked by customers and outlines how these questions are answered by the agent, helping to monitor trending questions and the popularity of each question.
What metrics are included in the Overall KPIs dashboard of the Call Center Operations?
-The Overall KPIs dashboard includes metrics such as the number of calls, containment, call duration, cost savings, and average sentiment for the entirety of your data.
How can I review conversation topics by customer segmentation in the Customer and Topic Overview dashboard?
-In the Customer and Topic Overview dashboard, you can review conversation topics by customer segmentation, topic volume over time, overall conversation volume per day, or percentage of repeat callers.
What insights can I gain from the Virtual Agent Performance dashboard?
-The Virtual Agent Performance dashboard, applicable with Insights integration, allows you to monitor where your virtual agent performs well on its own or in comparison to live agents, providing insights into customer satisfaction and performance metrics.
How can the Agent Performance dashboard help in monitoring live agents' performance?
-The Agent Performance dashboard helps in monitoring metrics such as waiting time to speak to a live agent by topic, identifying topics that require follow-ups, and reviewing a breakdown of live agents' performance, including average CSAT, number of conversations handled, and average waiting time.
What additional functionality does clicking on information in any dashboard provide?
-Clicking on any piece of information in a dashboard or graph automatically applies a filter, updating the entire Call Center Operations page to show all metrics by the applied filter, allowing for more granular monitoring of metrics.
Outlines

Esta sección está disponible solo para usuarios con suscripción. Por favor, mejora tu plan para acceder a esta parte.
Mejorar ahoraMindmap

Esta sección está disponible solo para usuarios con suscripción. Por favor, mejora tu plan para acceder a esta parte.
Mejorar ahoraKeywords

Esta sección está disponible solo para usuarios con suscripción. Por favor, mejora tu plan para acceder a esta parte.
Mejorar ahoraHighlights

Esta sección está disponible solo para usuarios con suscripción. Por favor, mejora tu plan para acceder a esta parte.
Mejorar ahoraTranscripts

Esta sección está disponible solo para usuarios con suscripción. Por favor, mejora tu plan para acceder a esta parte.
Mejorar ahora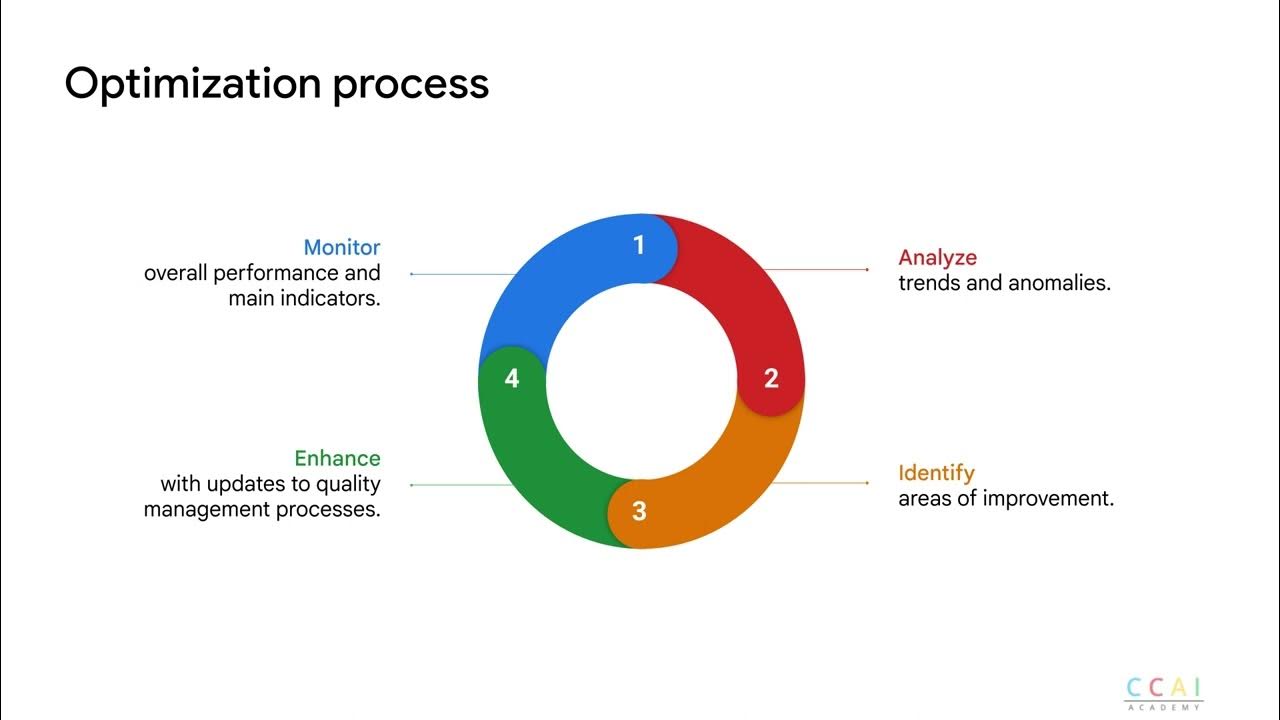


5.0 / 5 (0 votes)
